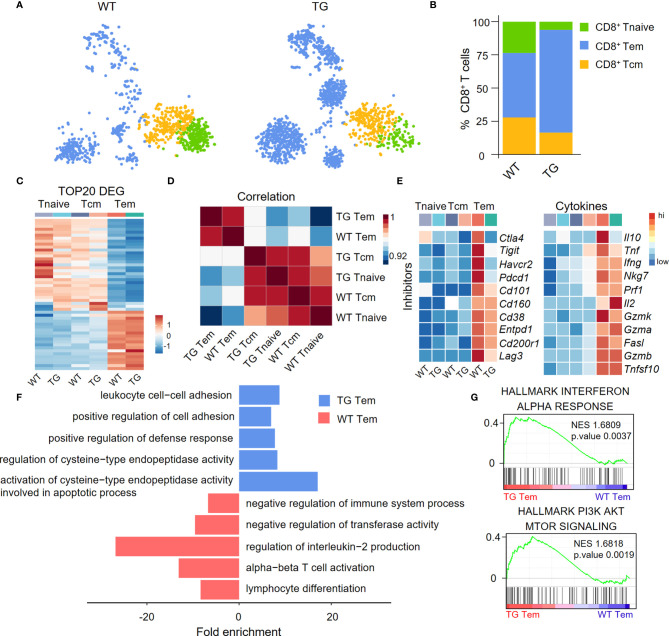
Figure 3.
Characterization of liver CD8+ Tem cells in TG mice. (A) CD8+ T cell subpopulations from WT and TG mice, including naïve CD8+ T cells, central memory CD8+ T cells and effector memory CD8+ T cells, shown with split t-SNE plots. (B) Percentage of CD8+ T subpopulations of WT and TG mice. (C) Scaled average expression of the top 20 upregulated differentially expressed genes for each CD8+ T subpopulations. Individual cells are represented on the horizontal axis and grouped by cluster. (D) The correlation analysis of average gene expression among CD8+ T subpopulation of WT and TG mice. (E) Scaled average expression of inhibitory checkpoint molecules and cytokines by CD8+ T subpopulations from WT and TG mice. (F) GO analysis of the upregulated genes in effector memory CD8+ T cells of WT and TG mice. (G) GSEA analysis of Interferon-α response and PI3K-AKT-mTOR signaling for effector memory CD8+ T cells between TG and WT mice. The normalized enrichment score (NES), original p value and FDR adjusted p values (q.value) are displayed.

