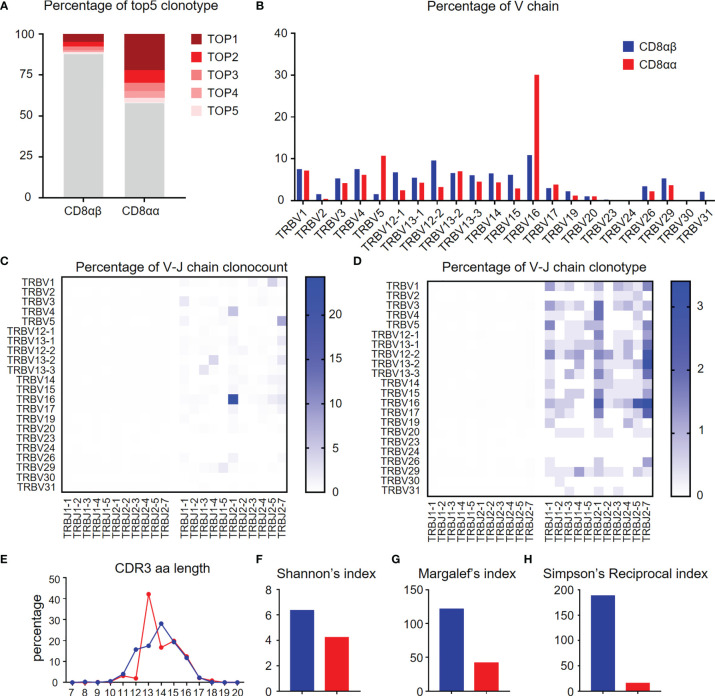
Figure 6.
Diversity of TCR repertoire of hepatic CD8αα and CD8αβ T cells of TG mice. (A) Percentage of the top 5 TCR β-chain clonotypes in CD8αβ and CD8αα T cells from TG mice. (B) Frequency of functional V chains in CD8αβ and CD8αα T cells from TG mice. (C, D) Heat-maps of TCR β-chain V-J pairing usages in count (left) and type (right) for CD8αβ (left) and CD8αα (right) cells from TG mice. (E) CDR3 repertoire amino acid (AA) length distribution of TCRβ chain in CD8αβ and CD8αα cells from TG mice. (F–H) Diversity index of TCR β-chain repertoires in CD8αβ and CD8αα cells from TG mice, including Shannon’s index (F), Margalef’s index (G) and Simpson’s Reciprocal index (H).

