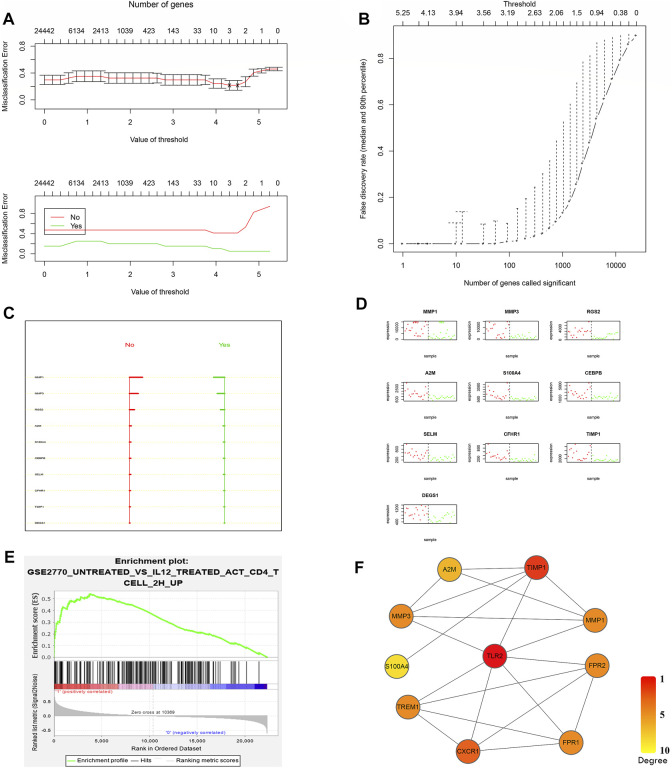
FIGURE 3.
Confirmation of the core predictors after screening. (A) Misclassification error analysis under the PAM predictive model and model gene number. (B) Curve of the false discovery rate. The lowest false rate was observed when the threshold was 3.938 in the PAM model. (C) No-score (nonresponders) and yes-score (responders) for the best classified genes, supporting the favorable predictive value when the range widened. (D) Actual classification effects of these 10 risk genes. (E) Third-ranked GSEA results from GSE16879 nonresponders. The gene set was a Th1 immune response gene set in the database. (F) The core scoring network from CytoHubba for combined top differentially expressed genes and lowest misclassification genes.

