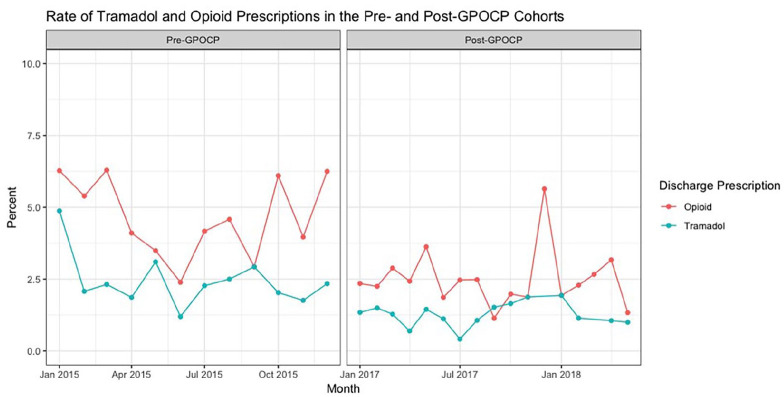
Figure 1.
This graph illustrates the opioid (red) and tramadol (blue) prescription rates in the pre-GPOCP and post-GPOCP cohorts. No data was abstracted from 2016 to allow time for guideline adoption at our institutions. A decline in both opioid and tramadol prescriptions at hospital discharge can be seen from the pre-GPOCP cohort to the post-GPOCP cohort.

