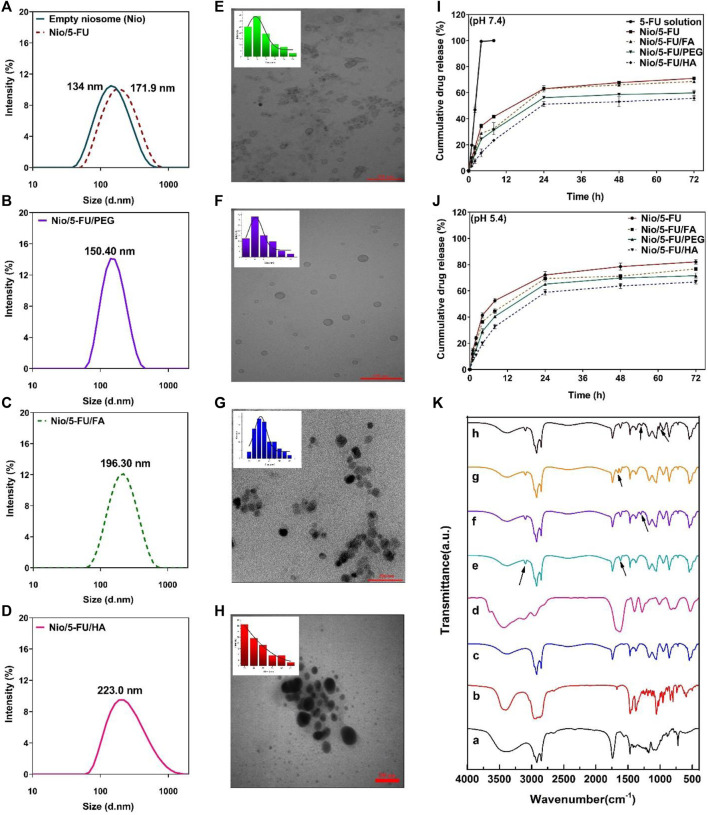
FIGURE 4.
(A–D) The particle size of synthesized niosomes as determined by dynamic light scattering. (E) Transmission electron micrograph and size distribution of Nio/5-FU. (F) Transmission electron micrograph and size distribution of Nio/5-FU/PEG. (G) Transmission electron micrograph and size distribution of Nio/5-FU/FA. (H) Transmission electron micrograph and size distribution of Nio/5-FU/HA. (I) In vitro release of 5-FU from different niosomal formulations at pH 7.4: 5-FU-loaded pristine niosomes (Nio/5-FU) and those that had been decorated with folic acid (FA), polyethylene glycol (PEG) or hyaluronic acid (HA). (Nio/5-FU/FA). (J) In vitro release of 5-UL from different niosomal formulations at pH 5.4. (K) Fourier transform infrared FTIR spectra of a) Span 60, b) Cholesterol, c) niosome, d) 5-FU, e) Nio/5-FU, f) Nio/5-FU/PEG, g) Nio/5-FU/HA, and h) Nio/5-FU/FA.

