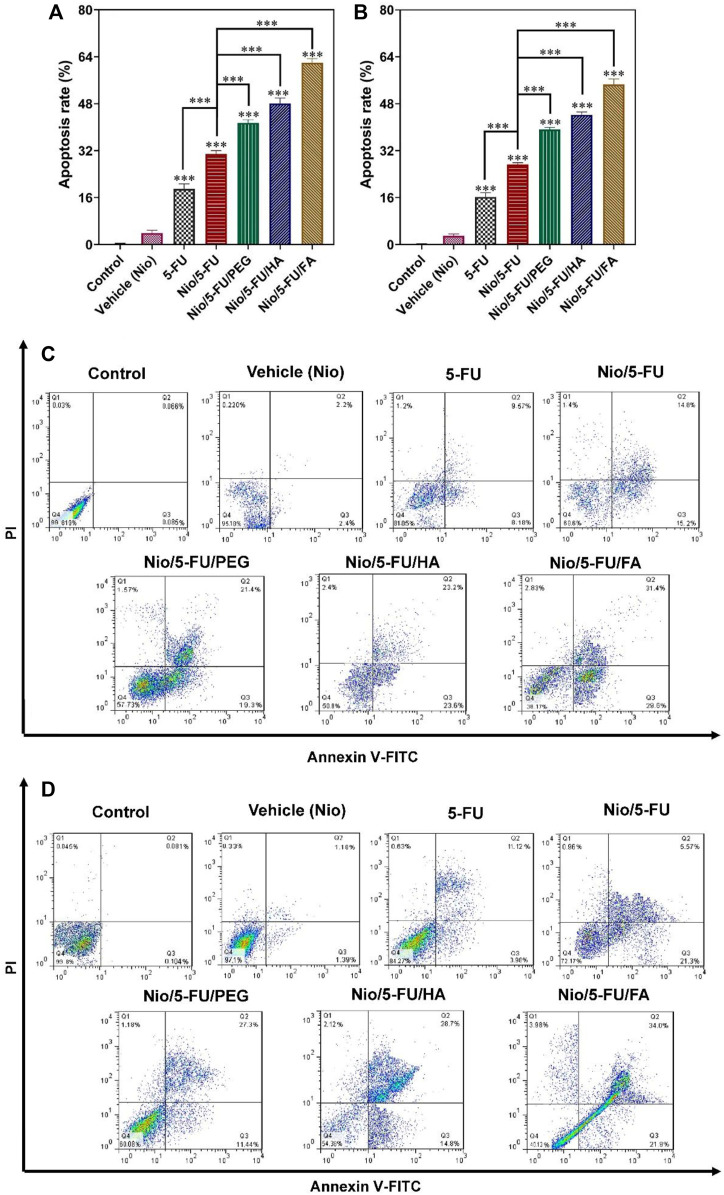
FIGURE 6.
The effects of control, 5-FU and different niosome formulations (Nio), 5-FU, Nio/5-FU, Nio/5-FU/PEG, Nio/5-FU/HA and Nio/5-FU/FA of (A) MCF7 and (B) 4T1 breast cancer cells that became apoptotic after 48 h of treatment. Data represent means ± standard deviations (n = 3). For all charts, ***: p < 0.001; **: p < 0.01; *: p < 0.05. (C,D) Flow cytometric analysis of (C) MCF7 and (D) 4T1 cells after treatment with IC50 concentration of vehicle (Nio), 5-FU, Nio/5-FU, Nio/5-FU/PEG, Nio/5-FU/HA and Nio/5-FU/FA formulations. The upper left square (Q1) shows the percentage of necrotic cells, and the upper right square (Q2) exhibits the percentage of late apoptotic cells, (Q3) exhibits the percentage of early apoptotic cells, and (Q4) shows the percentage of live cells.

