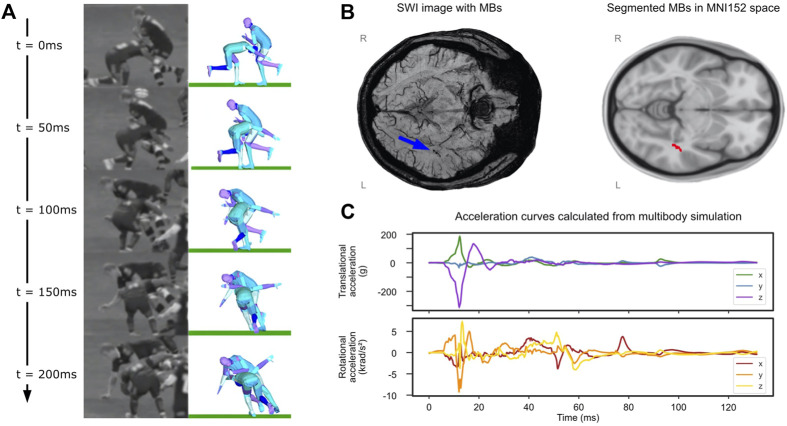
FIGURE 5.
Rugby collision results. (A) Comparison of reconstruction to video at 50 ms intervals, patient of interest is tackling player on the left at t = 0. (B) (left) SWI image with microbleeds identified by blue arrow and (right) segmented microbleed in MNI5152 space. (C) Translational and rotational accelerations of player’s head taken from the multibody simulation.

