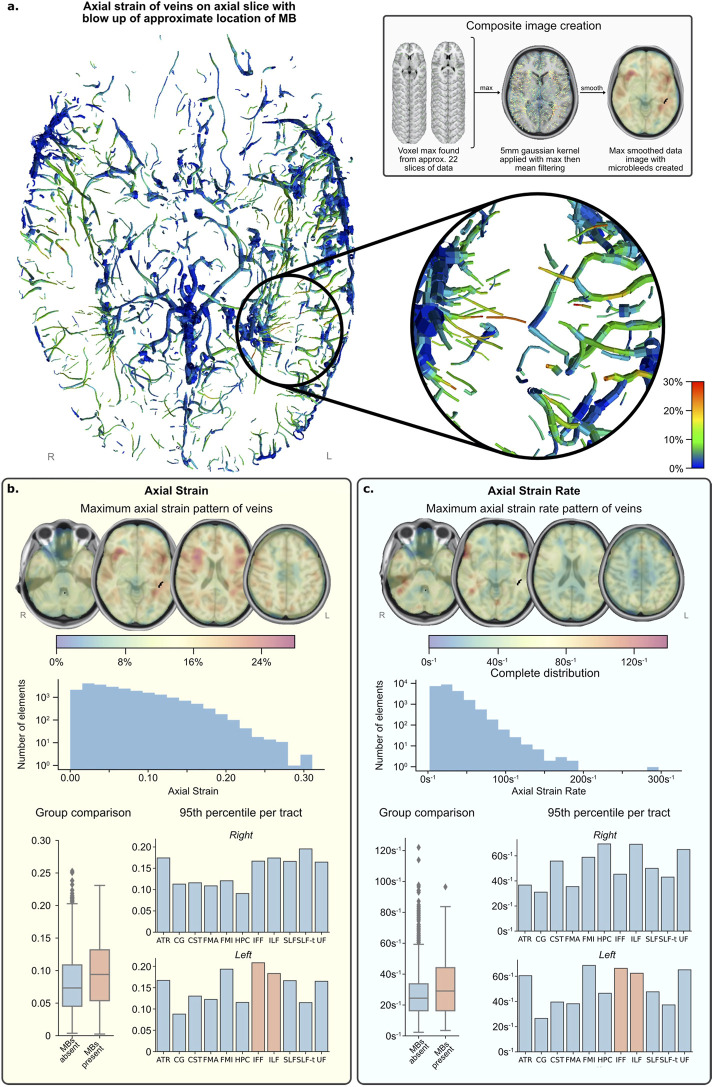
FIGURE 6.
FE simulation results. (A) Axial slice of inferior section of veins with maximum strain over time fringe colours. (lower right) Zoomed area of left temporal region shows several elements reaching peak strain levels (0.25–0.30) and is the approximate location of the MBs (upper right) Grey box shows image processing technique used to create composite images in (B,C). (B) Vein axial strain results. (C) Vein axial strain rate results. NB. Strain and strain rate results (B,C)—henceforth called the data—present results in the same format: (top) composite images showing the pattern of data across all time with values calculated from maximum and mean filtering of raw data for visualisation; (middle) histogram of distribution of data from all vein elements in the simulation, not just those present in regions of interest; (bottom left) distribution of grouped regions with MBs compared to those without; (bottom right) 95th percentile of data per tract and per side, regions of interest with MBs present are highlighted in orange. Please see the Supplementary Figure S2 for the definition of the tracts.

