FIGURE 4.
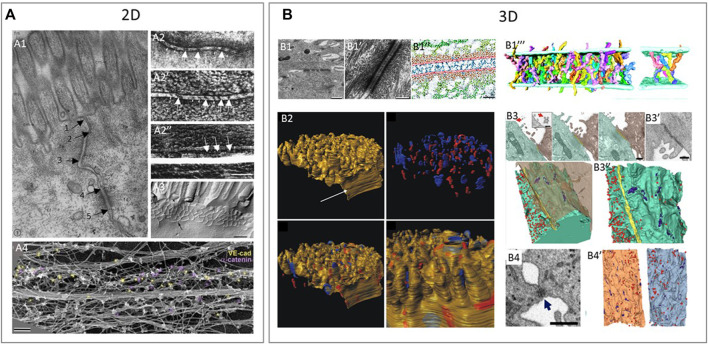
Examples of using various 2D and 3D imaging techniques to study the structure of intercellular junctions. (A) 2D imaging techniques to study the structure of tight junctions, adherens junctions and desmosomes. (A1): Transmission electron microscopy (TEM) shows a tight junction (arrow 1–2), adherens junction (arrow 2–3) and desmosome (arrow 4–5) in epithelium of intestinal mucosa of rat (Farquhar and Palade, 1963). (A2): Freeze fractured EM (FFEM) of epithelial junctions in which adherens junction is seen as a dense central structure between membranes (A2,A2’) and the underlying cytoplasmic actin bundles (A2’’) in retinal pigment epithelium (Miyaguchi 2000). (A3): FFEM of tight junctions in mouse epithelial cells (Furuse 2010) A4: Platinum replica electron microscopy (PREM) is an EM based technique that allows researchers to image actin bundles next to junctions and in this study, researchers showed vascular-endothelial-cadherin (yellow) and α-catenin (purple) by immunogold labelling in relation to the actin cytoskeleton of linear endothelial adherens juctions (Efimova and Svitkina, 2018). (B) 3D techniques to study the structure of tight junctions, adherens junctions and desmosomes. (B1): Desmosomes between keratinocytes in neonatal mouse epidermis imaged by electron tomography (ET). ET image of desmosome (B1-B1’) and the cadherin molecules crossing the extracellular space (blue in B1’’) in an annotated image. Reconstruction of individual cadherin molecules of a desmosome (B1’’’) (He et al., 2003). (B2): 3D representation of a murine cardiac intercalated disc imaged by focused ion beam scanning EM (FIB-SEM). Desmosomes (blue) and gap junctions (red) in the intercalated disc of murine cardiac muscle cells (Vanslembrouck et al., 2018). (B3, B4): Tight junctions and desmosomes between SARS-CoV-2 virus infected cells (B3) and human lung epithelial cells (B4) imaged by FIB-SEM. (B3): Two neighboring cells with a tight junction (yellow) at the contact site (B3) and a scanning EM (SEM) image of the tight junction seen as a dense structure between cells (B3’). 3D reconstruction of neighboring cells seen in (B3), with the tight junctions (yellow), small focal adhesions, likely desmosomes (purple) and virus particles (red) (B3’’). (B4): Desmosome-like junction between epithelial cells imaged by SEM is visible as a dense short structure and a 3D reconstruction of neighboring cells seen in (B4) with virus particles (red) and desmosome-like junctions (blue) (B4’) (Baena et al., 2021). Reproduced/adapted with permission.

