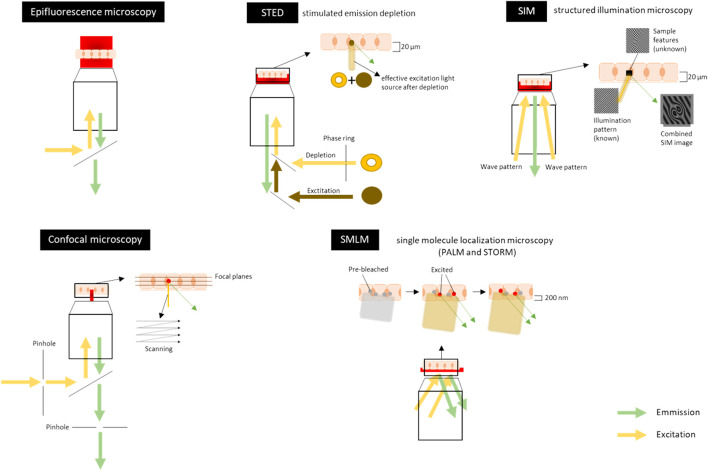
FIGURE 5.
Schematic overview of visible light-based techniques for imaging the tight junctions, adherens junctions and desmosomes. Sample is represented here as a layer of cells, which can either be fixed (chemically or by cryo-freezing) or non-fixed (live-cell imaging). The sample can also be a tissue section. In Epifluorescence microscopy the illumination light is transmitted through the sample which excites fluorescent molecules in the stained sample. It visualizes the (sub)-cellular structures in a large field of view in the sample to get a general overview of the intercellular junctions. Confocal microscopy uses lasers to illuminate and scan the tissue at a certain depth (focal plane). Pinholes are present to physically block out-of-focus light and to eliminate or reduce background information away from the focal plane. Emitted fluorescence is recorded. Scanning can be done at each focal plane to make optical sections throughout the tissue (5–30 µm). The lateral (xy) resolution is 500–100 nm and the axial (z) resolution is around 500 nm. For an example of an image, see Figure 3A. Stimulated emission depletion (STED) microscopy uses two overlapping, synchronized lasers that raster scan over the stained sample; one to excite the sample, the other to deplete some of the excited fluorophores to the ground state. The depletion of the fluorescence is done in a donut shape. This allows the excitation of only a small volume of the labeled fluorescent proteins in the sample. Emitted fluorescence is recorded. Imaging can be done throughout the tissue (up to 20 µm thick). The lateral (xy) resolution is 20–50 nm and the axial (z) resolution is 100–300 nm. Structured illumination microscopy (SIM) uses high frequency stripe-patterned excitation (the illumination/wave pattern) to illuminate the sample containing a fluorescent dye attached to a structure of interest. Emitted fluorescence is recorded. The imaging can be done up to 20 µm into a sample and optical sections can also be made along the z-axis. The lateral (xy) resolution is 100–130 nm and the axial (z) resolution is 100–350 nm. For an example of an image, Figure 3C. Single molecule localization microscopy (SMLM) [includes PALM (photoactivated localization microscopy) and STORM (stochastic optical reconstruction microscopy)] sequentially excites random subsets of fluorophores labelled to the protein of interest. In general, the fluorophores have an ON/OFF mechanism allowing a sparse population of non-overlapping emitters. A wide variety of organic and fluorescent dyes and different colors can be used and combined to get multiplex of single molecules. Emitted fluorescence is recorded. The light penetration depth is limited and there is scattering light. Imaging can only be done in the first 200 nm of the sample. The lateral (xy) resolution is 20–50 nm and the axial (z) resolution is 40–100 nm. For an example of an image, Figure 3C. Figures are not on scale.

