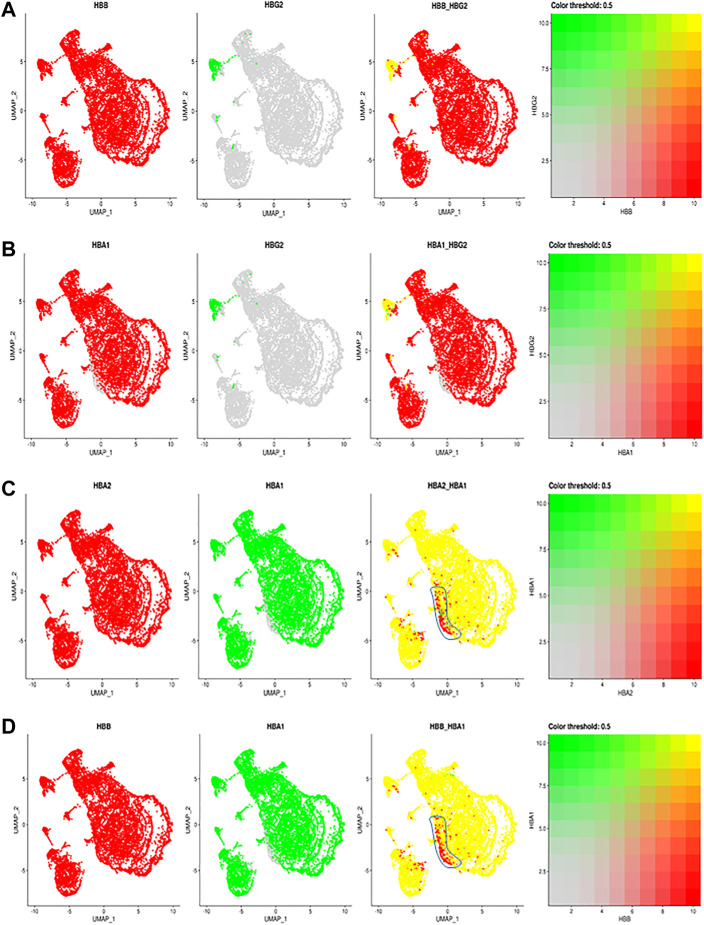
FIGURE 2.
The comparisons and correlations of different hemoglobin genes in the individual RBCs. Pairwise comparison of hemoglobin genes within the overall UMAP projection including (A) HBB vs. HBG2 (B) HBA1 vs., HBG2 (C) HBA2 vs. HBA1 and (D) HBB vs. HBA, where each gene is assigned a color red or green and the intersection of expression is yellow, or the absence of expression is reflected in the primary gene color (right of each figure).

