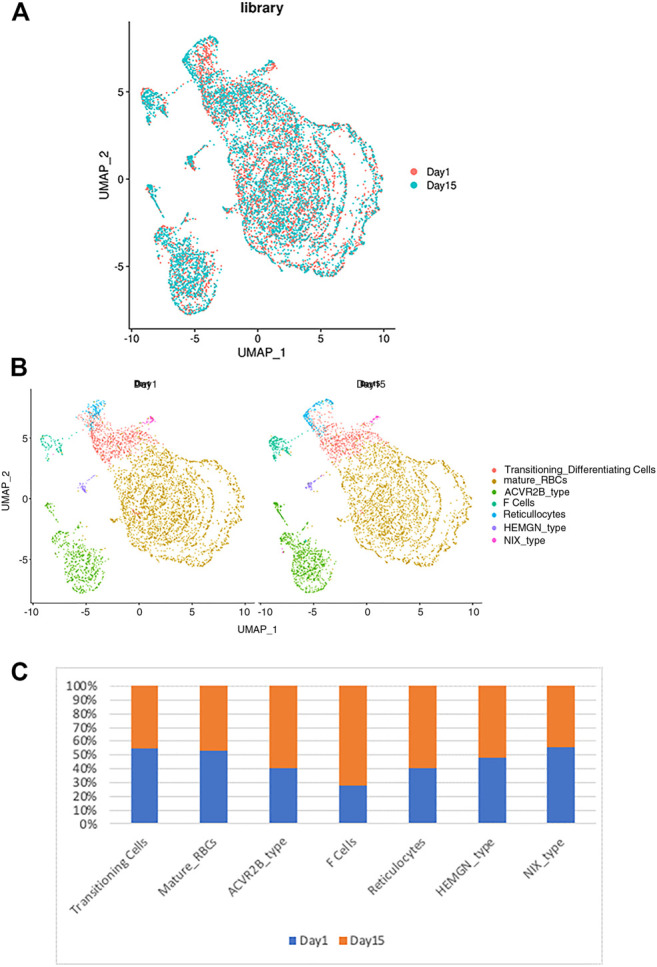
FIGURE 3.

The relationship between the RBC clusters and storage times. (A) The indicated storage days of individual RBCs were projected into the UMAP clusters of RBCs. (B) The UMAP presentation of the heterogeneous clusters of separate RBCs which have been stored for one (left) or 15 days (right). (C) The relative frequency of the seven representative RBC clusters in day 1 vs. 15 showing an increase in ACVR2B and F-cells in ex vivo stored RBCs.
