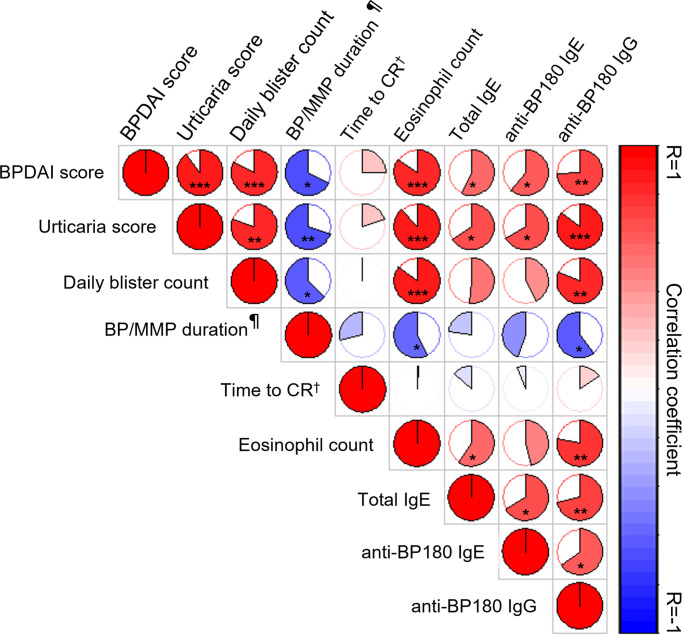
Figure 5.
Graphical representation of Spearman correlation matrix between clinical activity and immunological variables at baseline and outcomes. Red and blue colors indicate positive and negative correlations, respectively; the lighter the color, the less significant the corresponding correlation. The filled fraction of the circle in each pie chart corresponds to the absolute value of the associated Spearman correlation coefficient (r). *p < 0.05, **p < 0.01, ***p < 0.001, ¶ before omalizumab, † Time to complete remission.

