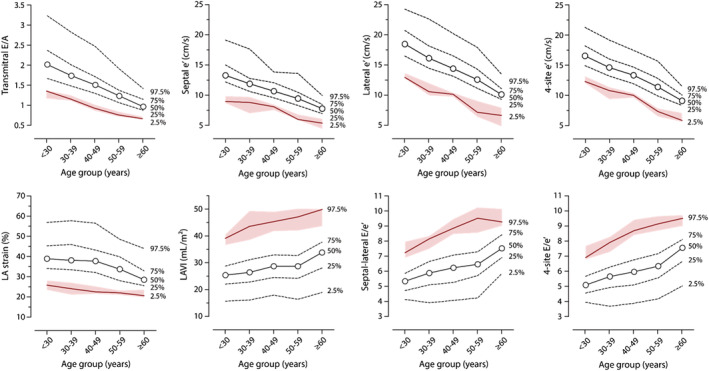
Figure 1.

Age‐specific percentiles of E/A ratio, e′ peaks, left atrial (LA) strain and volume index and E/e′ ratio for the healthy reference sample (n = 568). Shaded area represents 95% confidence intervals of the 2.5% or 97.5% thresholds (red line) as derived from their bootstrap distributions.
