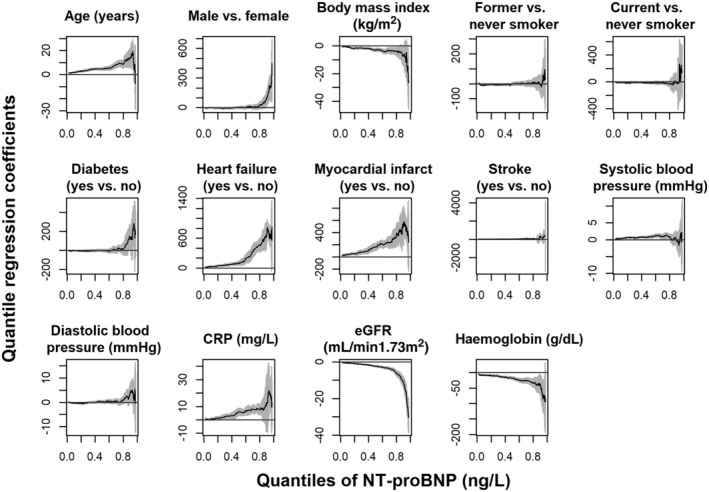
Figure 1.

Each plot shows the quantile regression coefficients with 95% confidence band (on the y‐axis) of a specific covariable in dependence of different quantiles (on the x‐axis), that is, different parts of the conditional distribution of the target variable NT‐proBNP (ng/L), among participants ≥65 years old and BMI ≥18 of ActiFE and SHIP‐TREND‐0 (N = 2459).
