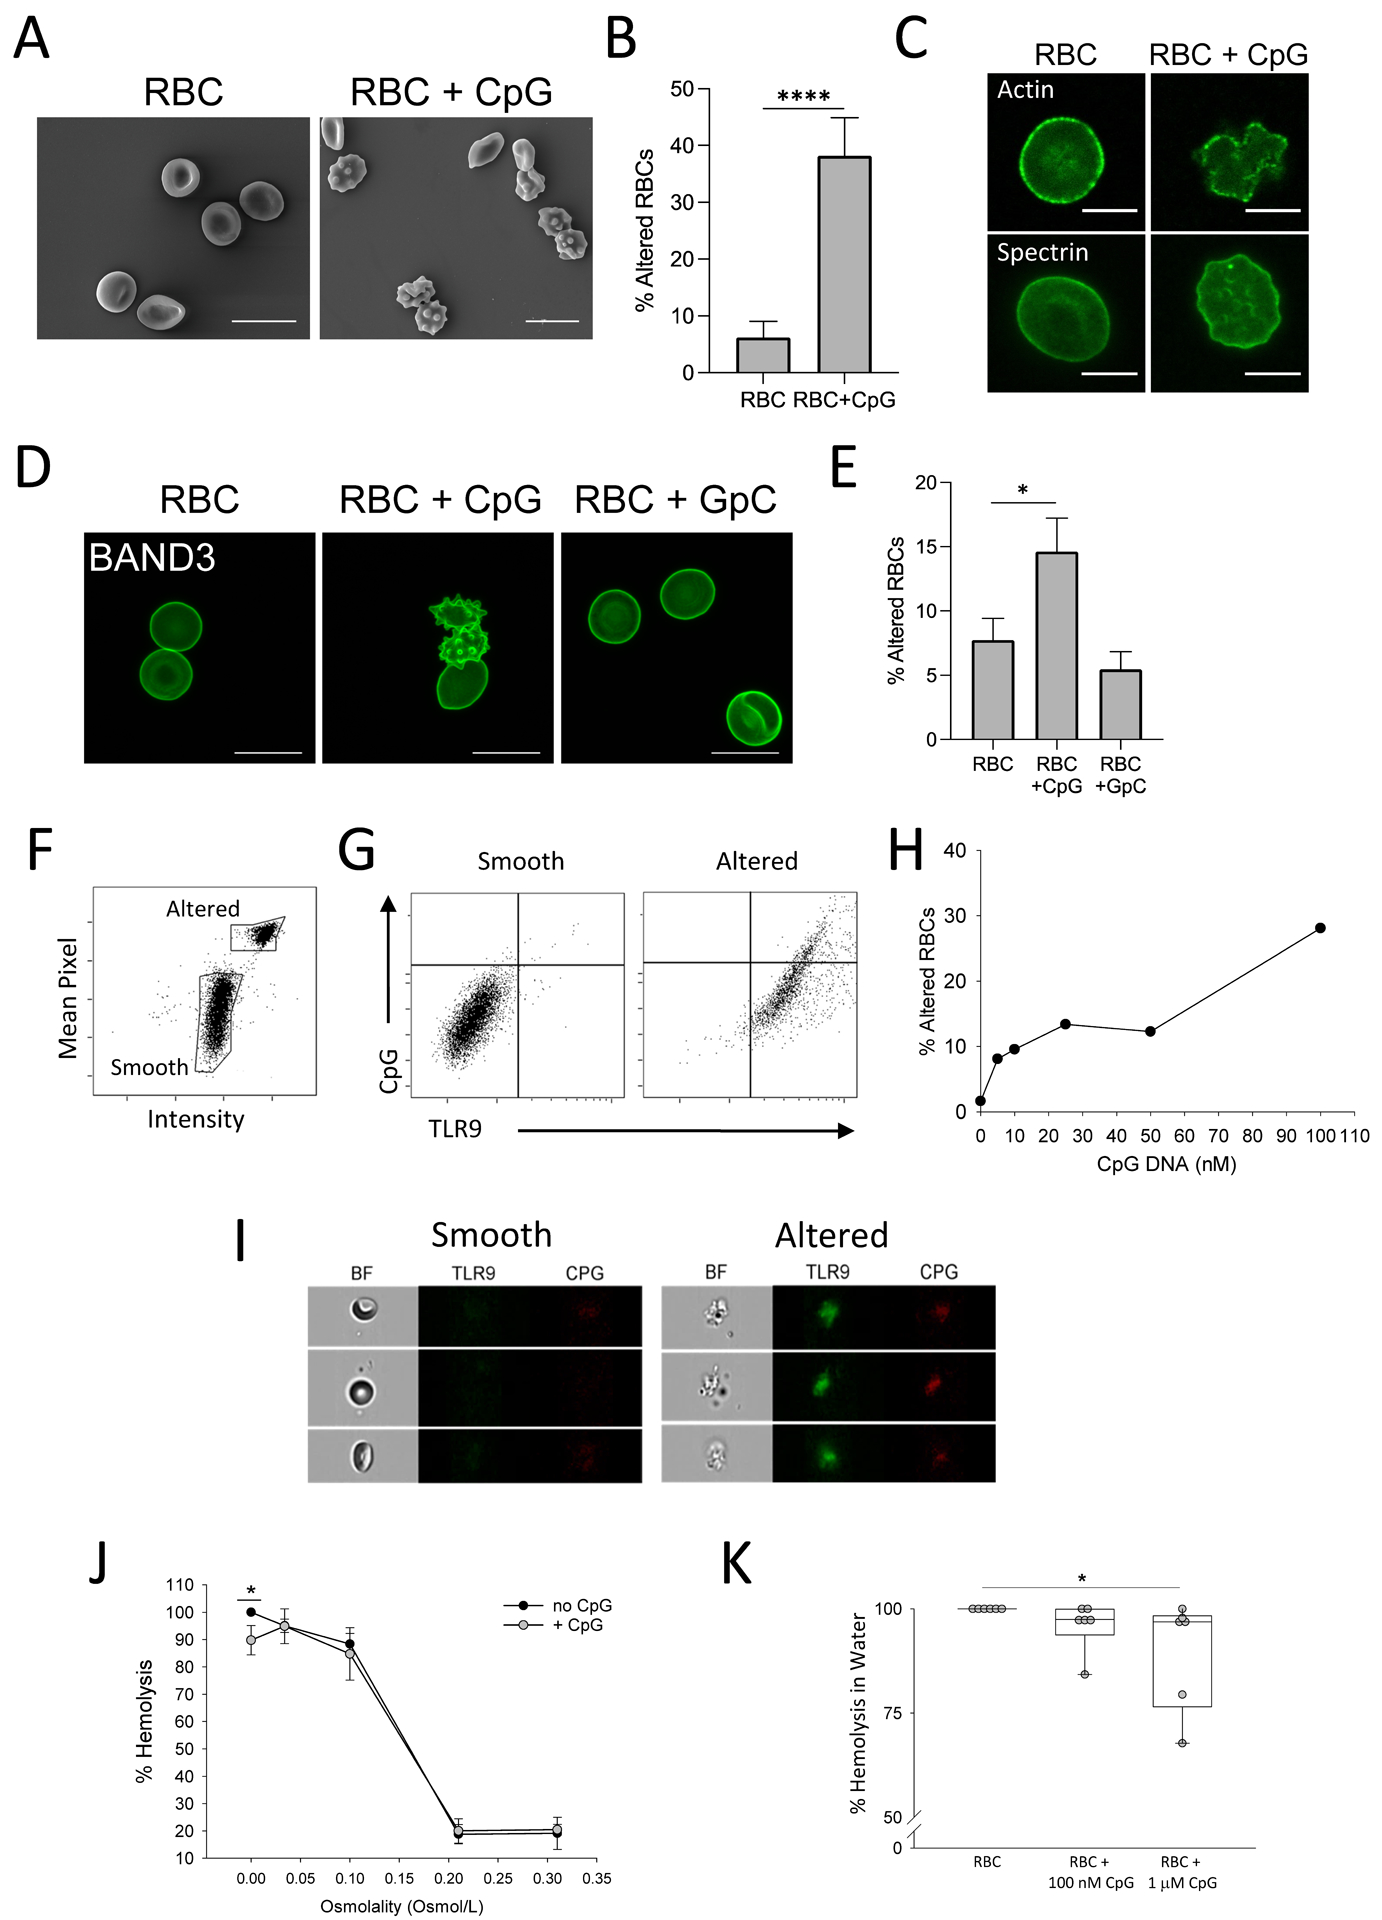
Figure 2. DNA binding results in altered RBC structure and function.

(A) Scanning electron microscopy of human RBCs following CpG treatment. Scale bar, 10μm. (B) The quantification of RBC alterations as observed by electron microscopy is shown. Alteration is defined by loss of biconcave disk shape and formation of echinocytes. Cells from five separate fields were counted and averaged; an unpaired t-test was used to calculate significance. (C) Confocal images show RBC cytoskeletal proteins actin and spectrin following CpG treatment. Scale bar, 5μm. (D) Confocal images show Band 3 expression following CpG and control GpC treatment. Naïve RBCs are also shown. Scale bar, 10μm. (E) Quantification of RBC alterations by Band 3 staining is shown. RBCs from four individual donors were tested. A Kruskal-Wallis test with Dunn’s post-hoc analysis was used to calculate significance. (F to I) Imaging flow cytometry analysis on CpG-treated human RBCs is shown. (F) Imaging flow cytometry reveals smooth and altered RBC populations as defined by Mean Pixel and Intensity parameters. (G) Smooth and altered RBC populations were analyzed for CpG binding and TLR9 expression. (H) The percent of altered RBCs with increasing doses of CpG is shown. (I) Images of smooth and altered RBCs are shown. (J) Osmotic fragility is shown for of healthy human RBCs pre-treated with PBS or 1 μM CpG; data were analyzed by a Mann-Whitney U test. (K) Hemolysis in water of RBCs pre-treated with PBS, 100 nM CpG, or 1 μM CpG is shown. RBCs from six independent donors were tested and data were analyzed by Kruskal-Wallis test with Dunn’s post-hoc analysis. Boxes display medians with interquartile ranges, each dot represents a healthy donor. For all panels, *P<0.05, **P<0.01, ***P<0.005, and ****P<0.001 denote significant findings.
