
Figure 6. Deletion of Erythrocyte TLR9 alters the host immune response.
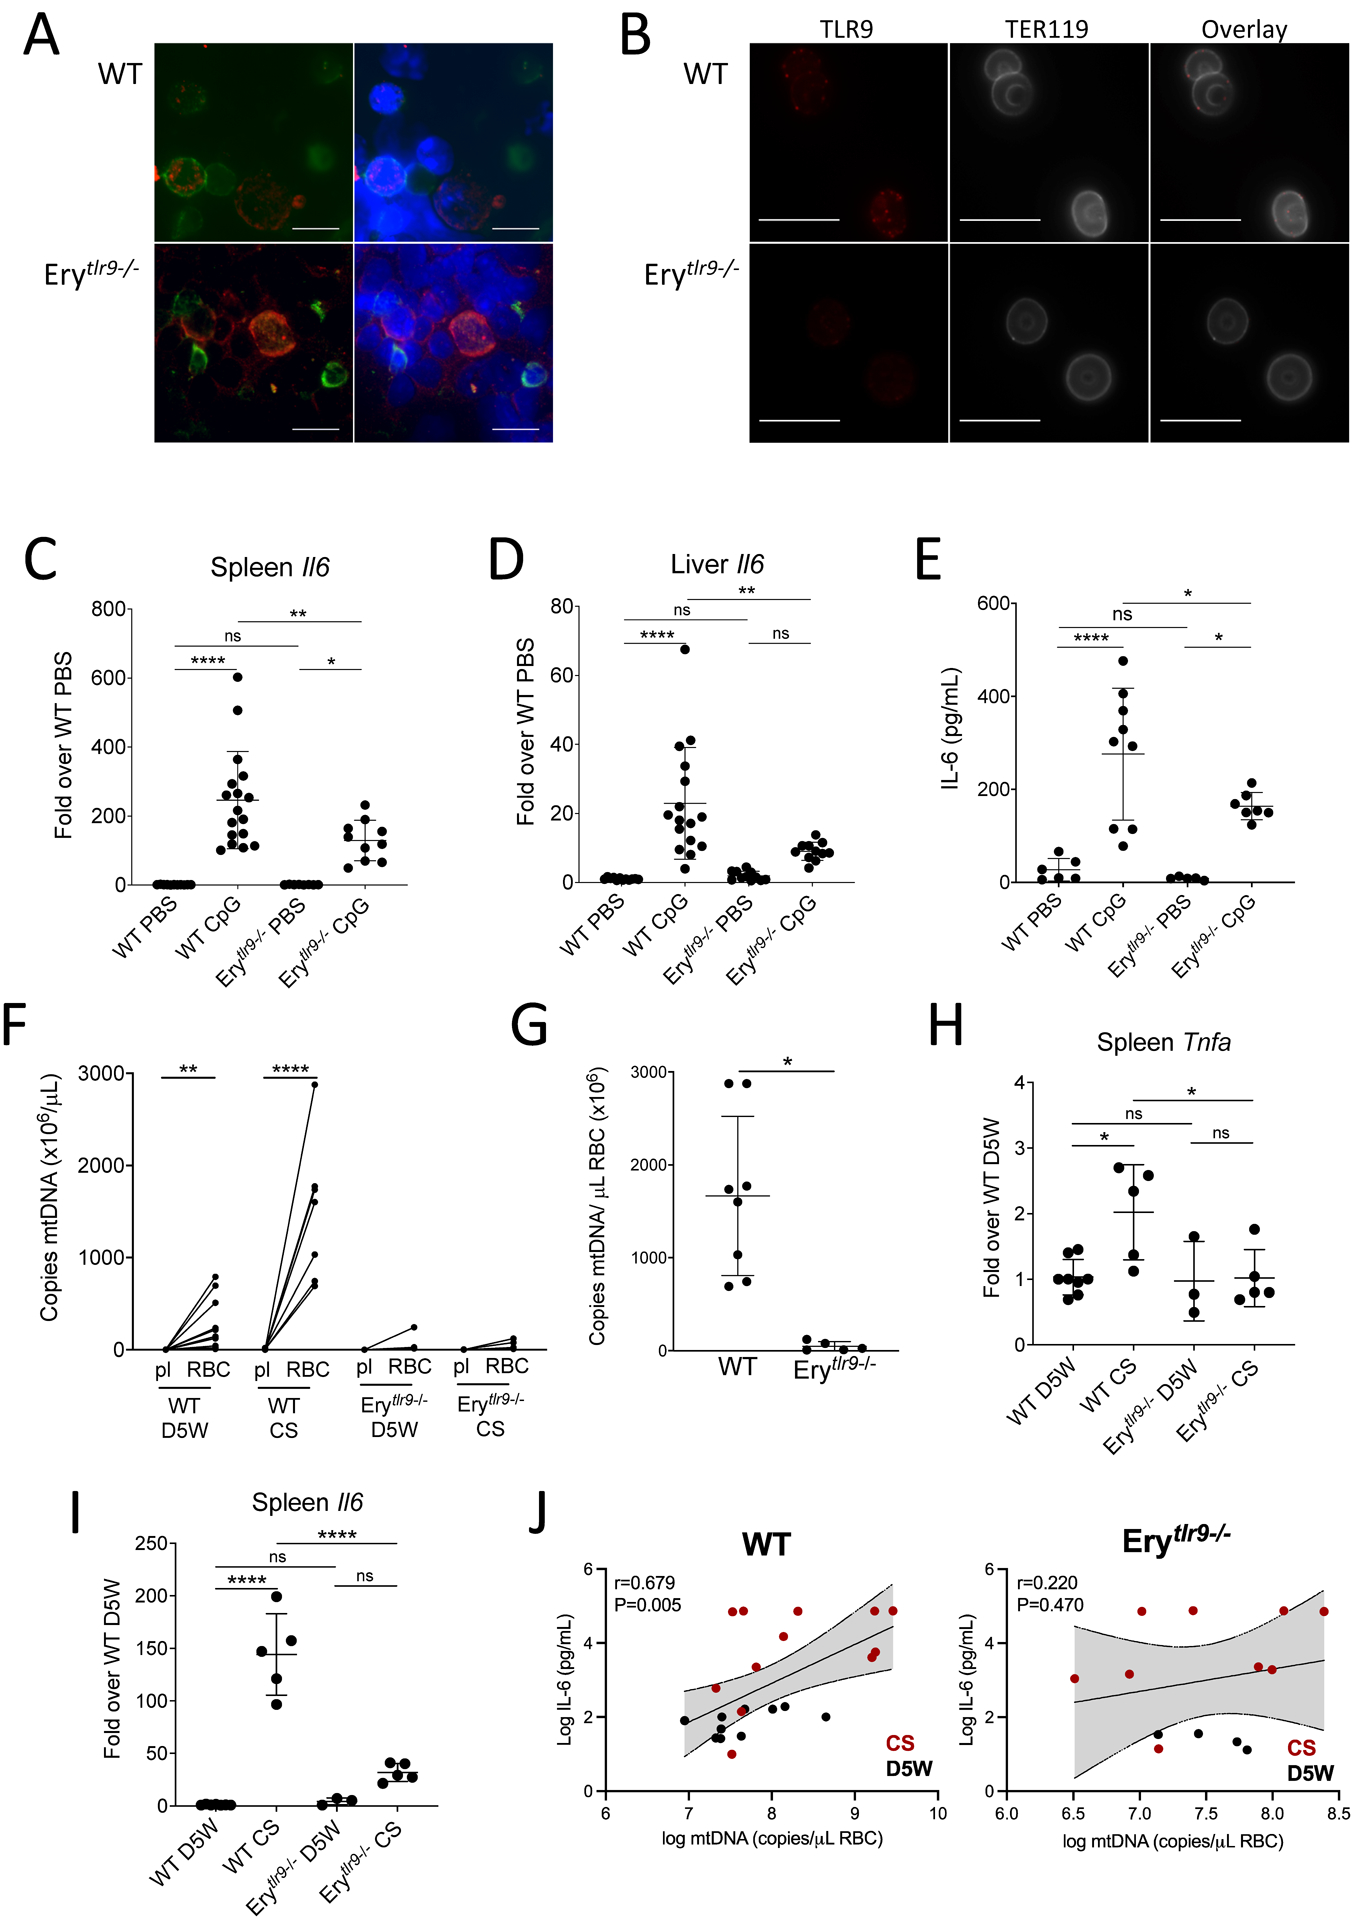
(A and B) TLR9 staining in a bone marrow smear (A) and mature RBCs (B) of WT and Erytlr9−/− mice are shown. The erythroid marker TER119 is used to identify erythroid cells. A representative image is shown. n=3 mice of each genotype were evaluated. Scale bars, 10μm. (C and D) Quantification of Il6 transcripts in spleens (C) and livers (D) of Erytlr9−/− mice following tail vein infusion with CpG (n = 8 or more per group). (E) Plasma IL-6 concentrations were measured in Erytlr9−/− mice following tail vein infusion with CpG (n=5 to 9 per group). In (C to E), data are presented as mean±SD and statistical analysis was done using a one-way ANOVA with Tukey’s correction for multiple comparisons. (F to I) Inflammatory responses of Erytlr9−/− mice were measured following cecal slurry (CS)-induced sepsis. (F) mtDNA on RBCs and in plasma (pl) of D5W and CS-treated mice was measured. Statistical analysis was done using a Kruskal-Wallis with a Dunn’s correction for multiple comparisons. This dataset is partially presented in Fig. 1H. (G) mtDNA on RBCs in CS-injected mice from (F) was compared. Statistical analysis was performed using a Kruskal-Wallis test followed by Dunn’s correction and data is presented as mean±SD. (H and I) Quantification of Tnfa (H) and Il6 (I) transcripts in spleens of injected mice is shown (n=3 to 8 mice per group, mean±SD). Statistical analysis was performed using a one-way ANOVA with a Holm-Sidak correction for multiple comparisons. (J) The correlation between plasma IL-6 and RBC-bound mtDNA is shown for control (D5W) and CS-treated WT and Erytlr9−/− mice. For all panels, *P<0.05, **P<0.01, ***P<0.005, and ****P<0.001 denote significant findings.