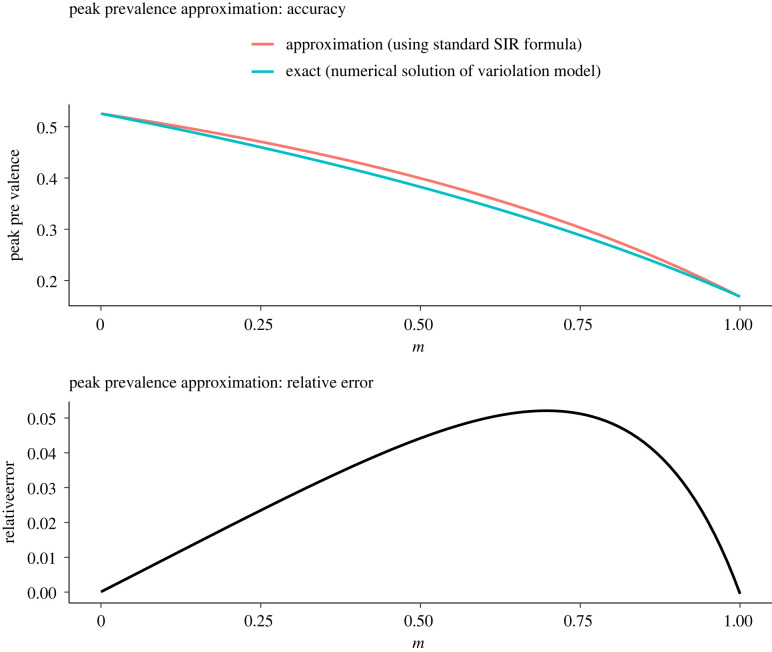
Figure 3.
Accuracy and relative error of the peak total prevalence approximated using the formula for the basic SIR model (equation (4.22)), as a function of the probability that an infection is mild (). Parameters other than are set to the values specified in tables 2 and 3. For each , the value of is computed using equation (4.1). The relative error is , where TRUE refers to the peak total prevalence obtained by numerically solving equation (3.1), and SIR refers to equation (4.22). The maximum relative error of the approximation is 5.5%, for (). In the extreme of perfect variolation (), , whereas in the extreme of completely ineffective variolation (), .

