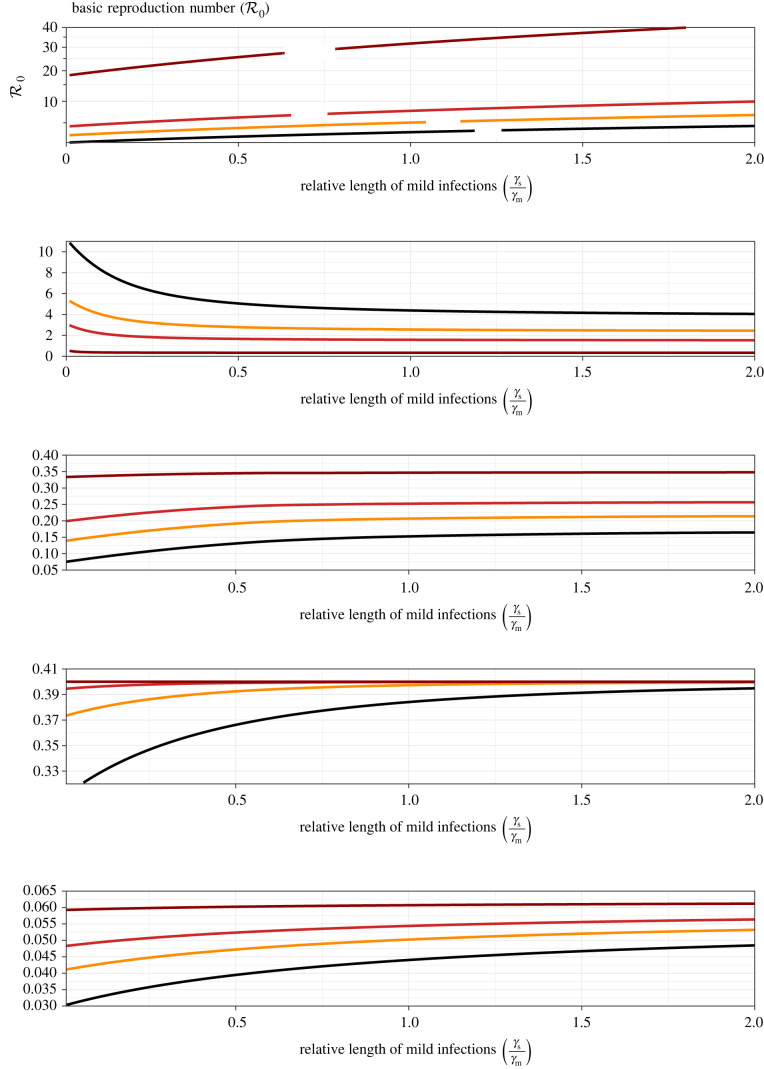
Figure 6.
Epidemiological risk metrics as a function of the relative length of mild infections (). The panels correspond to those in figures 4 and 5, but with different vertical axis ranges. The graphs were generated by varying while fixing all other parameters at their default values. The estimated values of (listed in table 2) are associated with the ratio of generation intervals listed in table 3 ().

