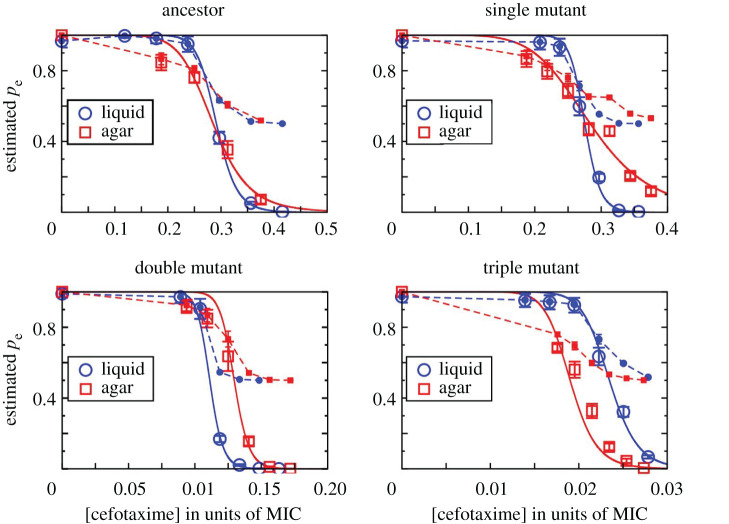
Figure 2.
The single-cell establishment probability, pe, is shown as open symbols for the four tested strains in liquid (blue circles) and agar environments (red squares) for different CTX concentrations as the fraction of each strain's measured MIC. For liquid medium, the combined results from both tested inoculum sizes (cf. figure 1) are shown. The solid lines are fits performed with the Hill function pe(x) = (1 + (x/x0)n)−1 with x0 and n as parameters, where x0 is the concentration at which pe drops to 1/2, and n indicates the steepness of the curve. The values of the inferred parameters are given in electronic supplementary material, table S2. The filled symbols connected by dashed lines show the cell division probability pd inferred from a simple branching model for the data points where pe > 0 (see main text). (Online version in colour.)

