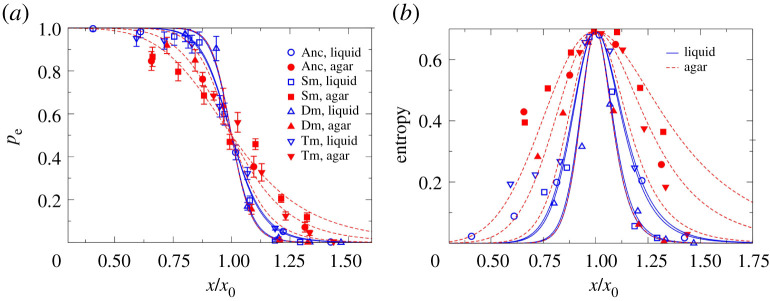
Figure 3.
(a) Establishment probabilities for all the strains in both liquid and agar environments as a function of CTX concentration (Anc: Ancestor, Sm: Single mutant, Dm: Double mutant, Tm: Triple mutant), scaled by the corresponding estimate x0 (i.e. the concentration at which pe drops to 0.5). The curves for agar medium (dashed red lines) are less steep than those for liquid medium (blue solid lines). (b) The Shannon entropy is calculated and plotted for the pe values, using the standard expression S = −pelnpe − (1 − pe)ln(1 − pe). It is seen to be higher for agar (dashed red lines and filled symbols) compared to liquid (solid blue lines and open symbols), as expected from the shallower slopes of the pe(x) curves for agar in panel (a). (Online version in colour.)

