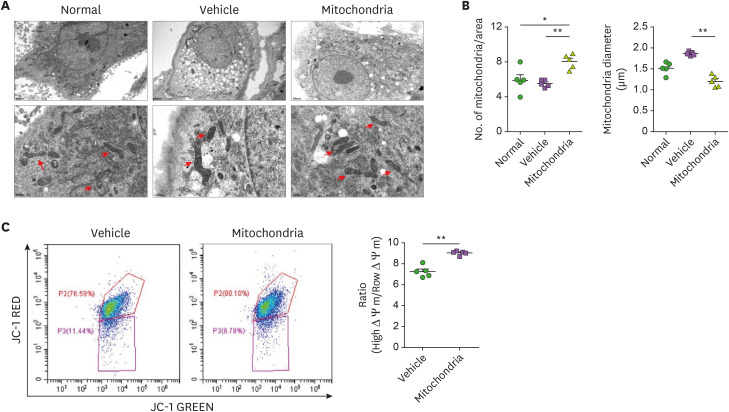
Figure 2. Improvement of mitochondrial function in chondrocytes of OA rats by mitochondrial transplantation. Chondrocytes were isolated from normal, MIA-induced OA rat, and mitochondrial transplanted-MIA-induced OA rats. (A) Representative transmission electron microscopy images show mitochodria in chondrocytes of each group. Red arrow, mitochondria. Scale bar, 2 μm (upper panels) and 0.5 μm (lower panels). (B) Bar graph shows averaged number of mitochondria (left) and mitochondrial diameter (right) in each group. (C) Mitochondrial membrane potential was measured by JC-1 staining. Data are means ± SEM.
*p<0.05, **p<0.01.

