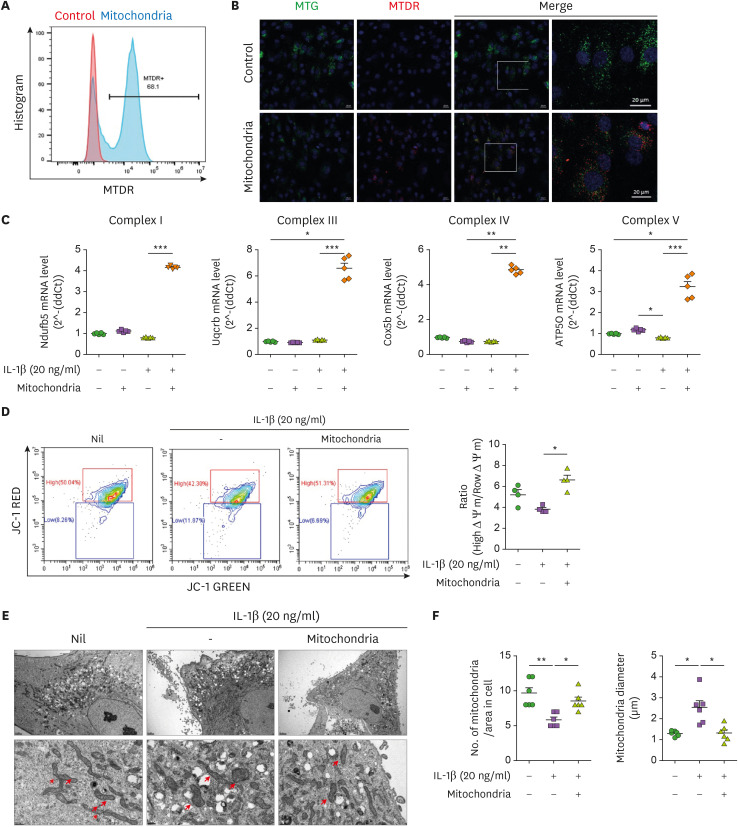
Figure 3. Improvement of mitochondrial function in human OA chondrocytes by mitochondrial transplantation. MTDR-stained mitochondria were transferred into human chondrocytes with MTG-labeled mitochondria. (A) Representative FACS plot shows percentages of MTDR-positive cells. (B) Representative images show MTG (greed), MTDR (red), and DAPI (blue) positive cells. Scale bar = 20 μm. (C) mtOXPHOS Complex genes were determined by RT-qPCR in OA chondrocytes incubated in the presence or absence of IL-1β (20 ng/mL) and mitochondria (5 μg) for 24 h. Average transcript levels of complex I, III, IV, and V. (D) Mitochondrial membrane potential analyzed by JC-1 staining. (E) Transmission electron micrographs of chondrocytes from OA patients in the presence or absence of IL-1β (20 ng/mL) and mitochondria (5 μg) for 24 h. Arrowheads, mitochondria. Scale: 2 μm (upper panels), 0.5 μm (lower panels). (F) The average number of mitochondria (left) and mitochondrial diameter (right). Data are means ± SEM.
*p<0.05, **p<0.01, ***p<0.001.

