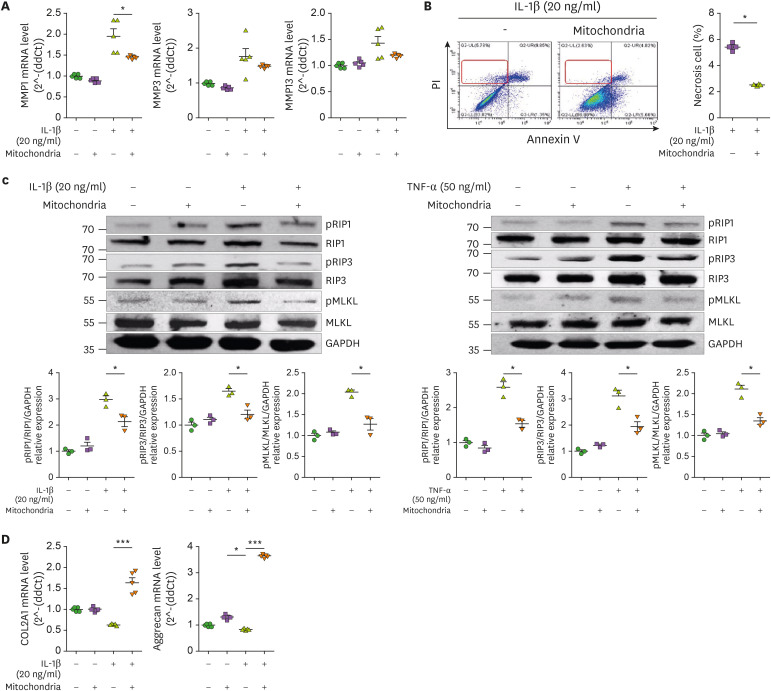
Figure 5. Expression of cell death and cartilage regulatory markers following mitochondria administration. Human OA chondrocytes were cultured in the presence or absence of IL-1β (20 ng/mL) or TNF-α (50 ng/ml) and mitochondria (5 μg) for 24 h. (A) mRNA levels of catabolic factors were analyzed by qPCR. (B) Necrosis analysis by annexinV/PI staining. (C) Expression of phospho- or total of RIPK1, RIPK3, MLKL in OA chondrocytes was analyzed by western blotting. (D) mRNA levels of chondrogenesis markers in OA chondrocytes. Data are means ± SEM.
*p<0.05, ***p<0.001.

