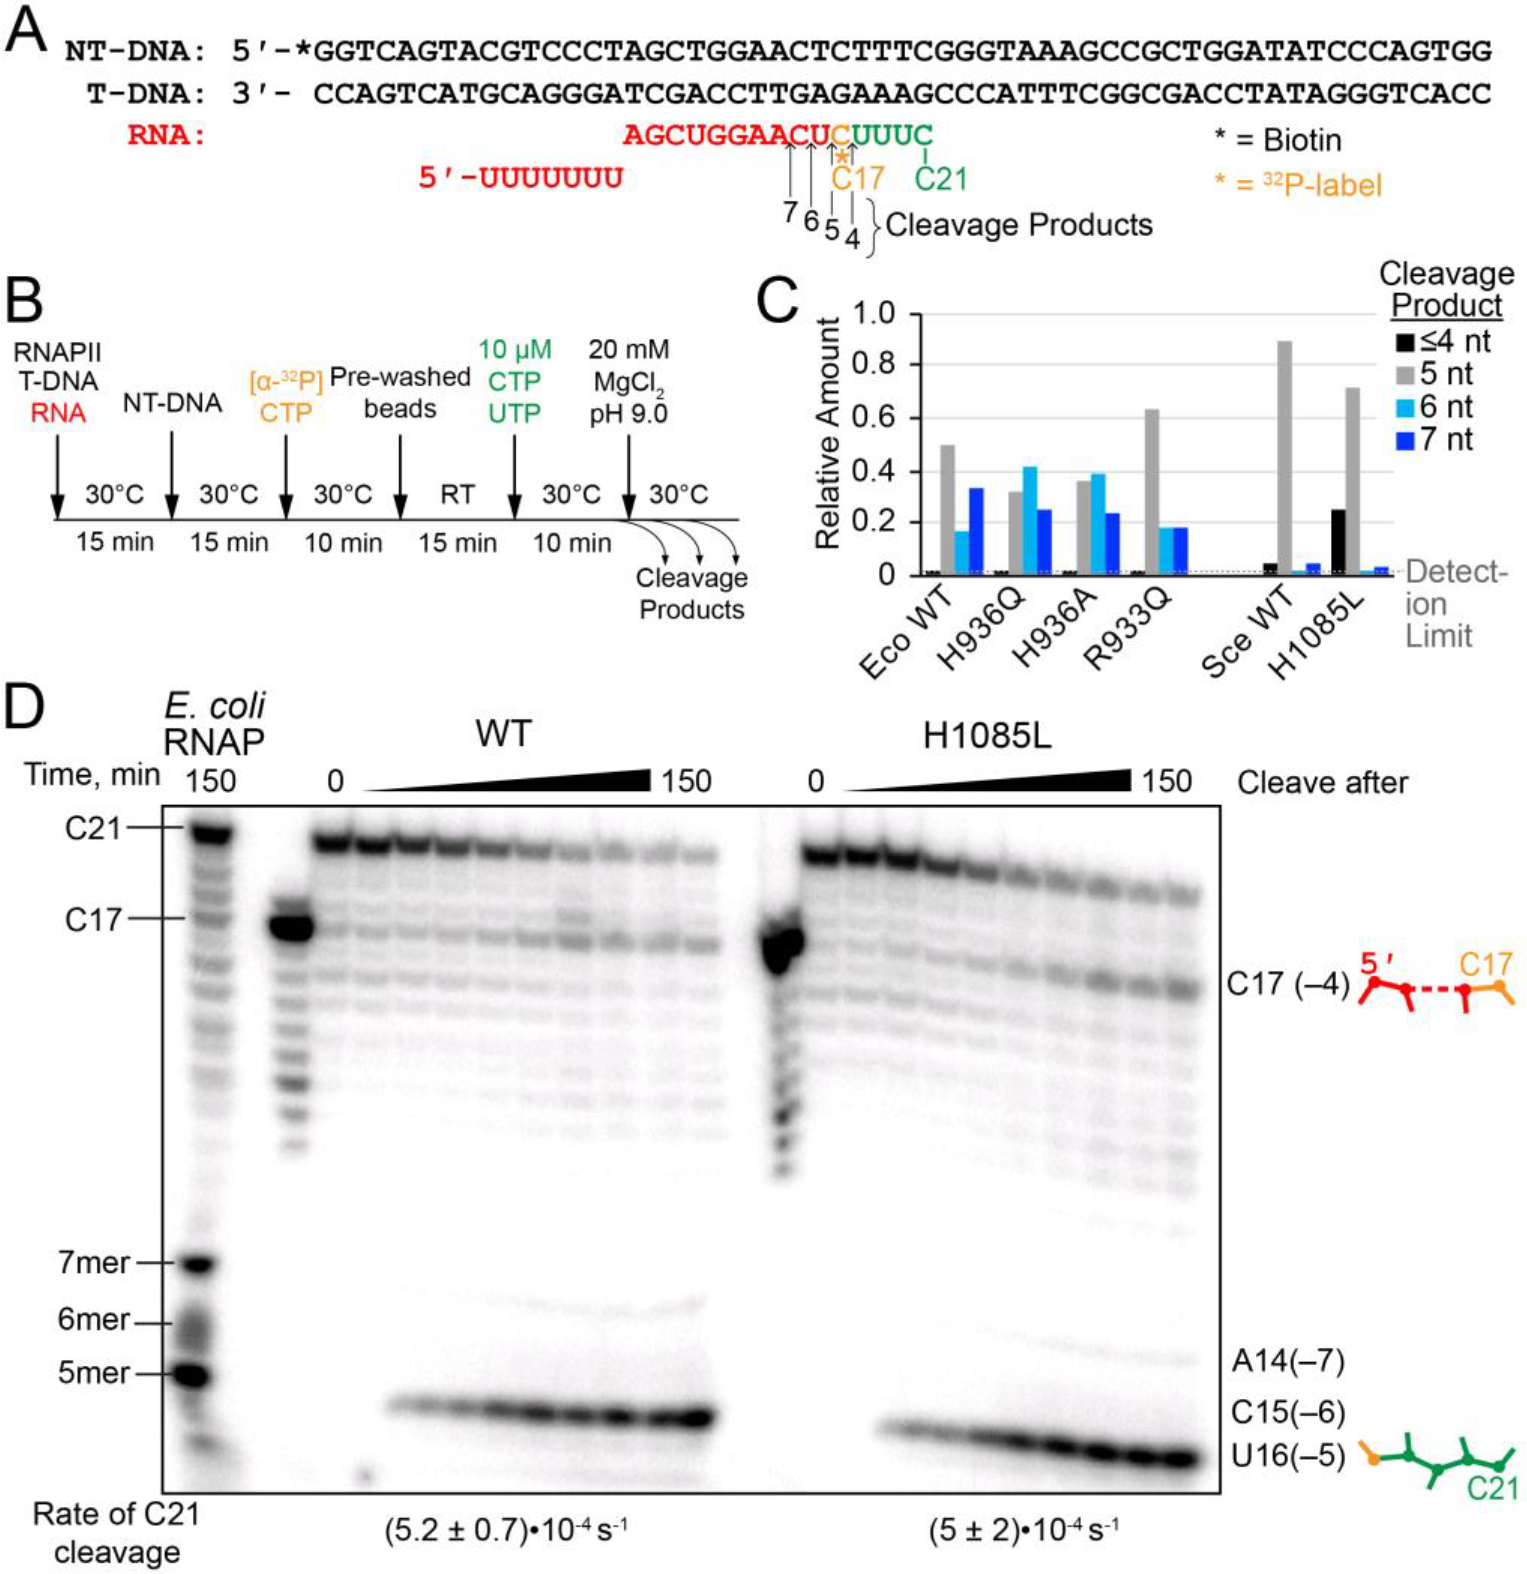
Figure 5. RNA hydrolysis by backtracked ECs.

(A) Scaffold 3, encoding the E. coli bglF backtrack pause signal.12 (B) Experimental steps in the backtrack cleavage assay. RNA was labeled by incorporation of [α-32P]CMP and extended to the pause position, then allowed to equilibrate among various backtrack registers. Cleavage was initiated by addition of Mg2+ in pH 9.0 buffer. (C) Quantitation of relative amounts of cleavage products from backtracked ECs. The data for E. coli RNAP were published previously.12 The data for yeast RNAPII were quantified from the gel shown in panel D. (D) Intrinsic cleavage by WT and H1085L RNAPII. A reaction with E. coli RNAP was performed and allowed to run for 150 min in order to identify the species produced by RNAPII. The H1085L mutation did not affect the rate of cleavage from the C21 position (unpaired two-sample t-test P=0.9603), which is shown below the gel lanes. See Figure S3 for kinetic fits of the data.
