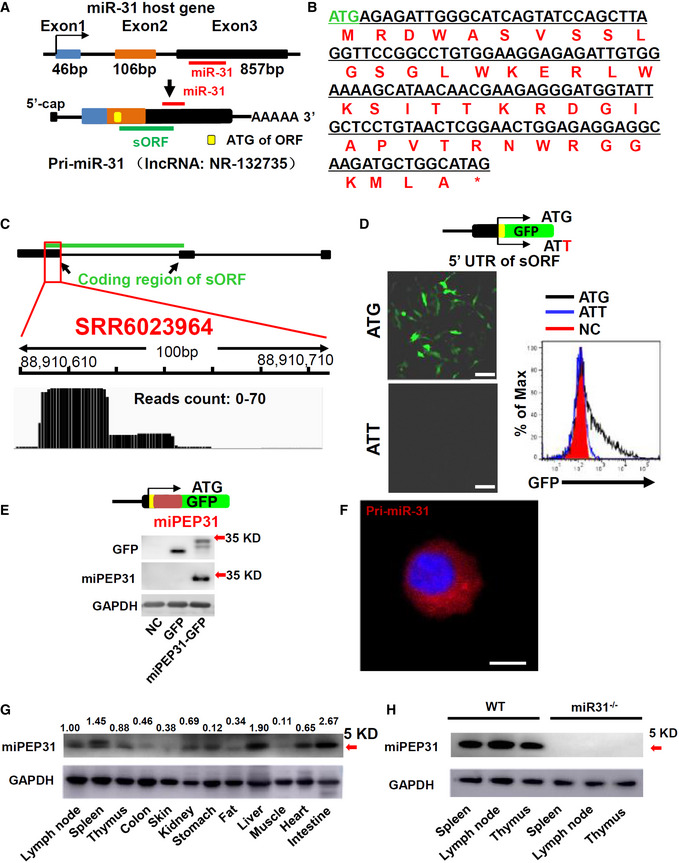
Figure 1. miPEP31 is an endogenous peptide encoded by pri‐miR‐31.

- Schematic representation of miPEP31 translation. Pri‐miR‐31 transcribed from the miR‐31 host gene. sORF was found by the ORF Finder. The yellow box indicates the ATG of the sORF. The red line indicates the sequence of miR‐31. And the green line indicates the location of sORF on pri‐miR‐31.
- The nucleotide and amino acid sequences of the sORF.
- Ribo‐seq data of NIH 3T3 cells (SRR6023964) were analyzed and visualized by IGV. Ribo‐seq reads were found on pri‐miR‐31. The red box indicates the reads on partial of the coding region of miPEP31.
- Plasmid with 5′ leading sequence of the sORF in pri‐miR‐31 fused with gfp or which ATG mutated to ATT was transfected into NIH 3T3 cells. Cells were selected by G418 for 2 days. Analysis of the GFP expression by confocal microscopy or flow cytometry, scale bar 100 μm.
- Immunoblot analysis of GFP and miPEP31 in NIH 3T3 cells transfected by pEGFP‐N1‐miPEP31 or pEGFP‐N1; the red arrow indicates predicted size of miPEP31‐GFP band.
- Flow‐FISH was used to detect the localization of pri‐miR‐31. The location of pri‐miR‐31 was analyzed by confocal microscopy. Scale bar 5 μm.
- Immunoblot analysis of multiple mouse tissues with a specific antibody against miPEP31. Values are expressed as fold changes relative to controls and normalized to GAPDH, the red arrow indicate predicted size of miPEP31.
- Immunoblot analysis of spleen, lymph node, and thymus from WT or miR‐31−/− mice with miPEP31 antibody, the red arrow indicates predicted size of miPEP31.
Source data are available online for this figure.
