-
A
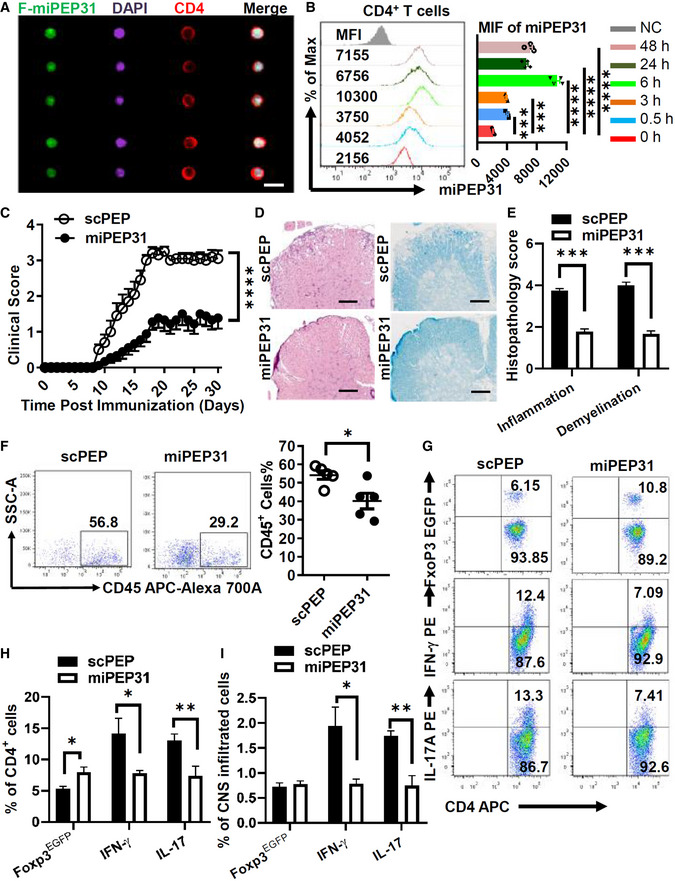
EAE was induced by MOG35‐55. FAM‐miPEP31 (50 μg) was injected intravenously every 2 days starting from day 8 postimmunization. Splenocytes from FAM‐miPEP31‐treated EAE mice were isolated on day 15 postimmunization and analyzed by imaging flow cytometry. Representative images of CD4+ population were shown, scale bar 10 μm.
-
B
miPEP31 (50 μg) was injected intravenously into C57BL/6 mice at different time points. Splenocytes from miPEP31‐treated EAE mice were isolated and the level of miPEP31 in CD4+ T cells was analyzed by flow cytometry. MFI of miPEP31 was shown. Data in (B) are presented as mean ± SEM of four biological replicates. ***P < 0.001, ****P < 0.0001 (0 h vs. 0.5 h or 3 h or 6 h or 24 h or 48 h), nonparametric one‐way ANOVA, Kruskal–Wallis test.
-
C–E
Clinical scores (mean and SEM) of scPEP‐ or miPEP31 (50 μg)‐treated mice after the induction of EAE were assessed every day (C). scPEP or miPEP31 was injected intravenously every 3 days starting from day 8 postimmunization. (D, E) H&E and Fast blue staining of paraffin sections of spinal cords derived from scPEP‐ or miPEP31‐treated mice on day 15 after immunization. Histopathology scores of inflammation and demyelination were shown in (E). Scale bars, 70 μm. Data in (C, E) are presented as mean ± SEM of three independent experiments with 9 to 10 mice per group in each. ****P < 0.0001, repeated‐measures two‐way ANOVA and Tukey post‐hoc test (C) and ***P < 0.001 unpaired two‐tailed Student’s t‐test (E).
-
F–I
EAE was induced by MOG35‐55 in FoxP3EGFP mice. scPEP or miPEP31 (50 μg) was injected intravenously every 2 days starting from day 8 postimmunization. Mononuclear cell infiltrates of scPEP‐ or miPEP31‐treated EAE mice were isolated from brains and spinal cords on day 15 postimmunization. (F) Flow cytometric analysis of CD45+ cells. (G, H) Flow cytometric analysis of FoxP3EGFP+ cells, IFN‐γ+ cells, and IL‐17+ cells in CD4+ T cells. (I) Percentage of FoxP3EGFP+ cells, IFN‐γ+ cells, and IL‐17+ cells in CNS infiltrated cells. Data in (F, H, and I) are presented as mean ± SEM of five (F) or three (H, I) biological replicates. *P < 0.05, unpaired two‐tailed Student’s t‐test (F) and *P < 0.05, **P < 0.01, nonparametric one‐way ANOVA, Kruskal–Wallis test.

