-
A
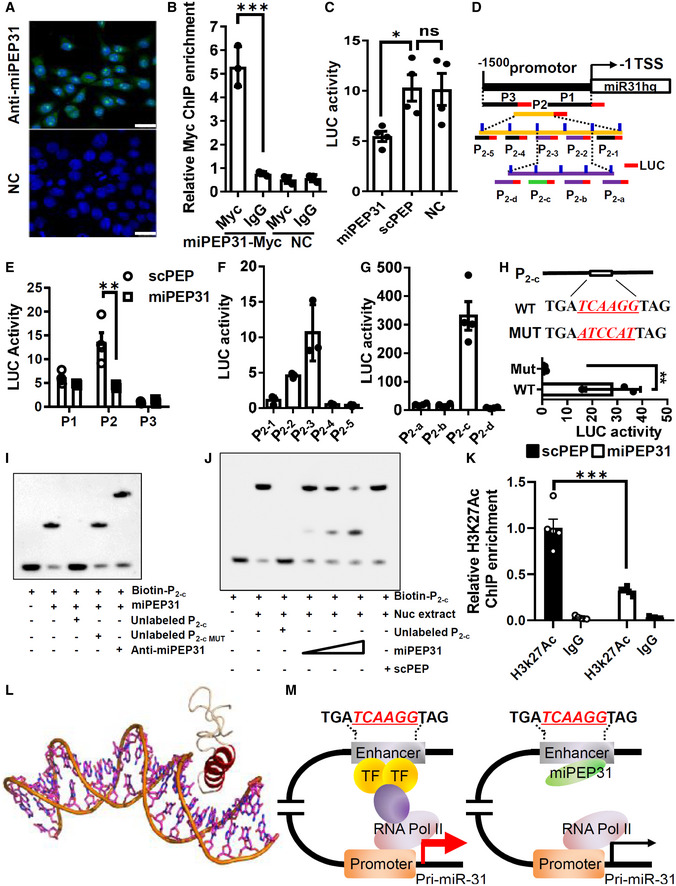
Fluorescence images of the immunolocalization of the miPEP31 in NIH 3T3 cells. Results are representative of three independent experiments, scale bar 25 μm.
-
B
pCDNA 3.1‐miPEP31‐myc or pCDNA 3.1‐NC was transfected into NIH 3T3 cells. Transfected cells were selected by G418 for 2 days. Myc was immunoprecipitated from the transfected cells. Immunoprecipitates were assayed for the expression levels of miR‐31 promoter. Data in (B) are presented as mean ± SEM of three biological replicates. ***P < 0.001, nonparametric one‐way ANOVA, Kruskal–Wallis test.
-
C
Luciferase activity in NIH 3T3 cells transfected with luciferase reporter plasmids of pGL3 empty vector or miR‐31 promoter, treated with miPEP31 or scPEP. Results are presented as the ratio of firefly luciferase‐to‐renilla luciferase activity, relative to that of untreated NIH 3T3 cells transfected with pGL3 empty vector. Data in (C) are presented as mean ± SEM of four biological replicates. *P < 0.05, ns, not significant, nonparametric one‐way ANOVA, Kruskal–Wallis test.
-
D–G
Three different regions (P1, P2, and P3) of miR‐31 promoter. The region P2 was divided into five sub‐regions P2‐1 to P2‐5 with 10 bp overlap with adjacent sub‐region as indicated. P2 (100‐310) (P2‐2 together with P2‐3) was divided into four sub‐regions P2‐a to P2‐d with 10 bp overlap with adjacent sub‐region. These regions were cloned into pGL3 empty vector and transfected into NIH 3T3 cells. Luciferase activity was measured in NIH 3T3 cells transfected with pGL3‐P1, P2, or P3 (E), P2‐1 to P2‐5 (F), and P2‐a to P2‐d (G). Results are presented as the ratio of firefly luciferase‐to‐renilla luciferase activity, relative to that of untreated NIH 3T3 cells transfected with pGL3 empty vector. Data in (E–G) are presented as mean ± SEM of four biological replicates. **P < 0.01, nonparametric one‐way ANOVA, Kruskal–Wallis test.
-
H
WT and mutant sequence in P2‐c. pGL3‐P2‐c or pGL3‐P2‐c with mutation (in red) was transfected into NIH 3T3 cells. Luciferase activity was measured. Data in (H) are presented as mean ± SEM of three biological replicates. **P < 0.01, unpaired two‐tailed Student’s t‐test.
-
I, J
EMSA assay to identify the interaction between miPEP31 and P2‐c or P2‐c with mutated (MUT). Anti‐miPEP31 was added to see the super shift. (J) EMSA assay to identify the interaction of P2‐c and NIH 3T3 cells nuclear extracts in the presence of different dose of miPEP31 or scPEP.
-
K
ChIP analysis of miR‐31 promoter by anti‐Histone H3K27Ac or IgG in NIH 3T3 cells treated with 10 μM synthetic scPEP or miPEP31. Data in (K) are presented as mean ± SEM of five biological replicates. ***P < 0.001 (scPEP vs. miPEP31), nonparametric one‐way ANOVA, Kruskal–Wallis test.
-
L
Cartoon representation of the modeled interaction between miPEP31 and DNA. Red helix is the DNA major groove binding helix from miPEP31; wheat chain is the coil.
-
M
Model illustrating the mechanistic role of miPEP31.

