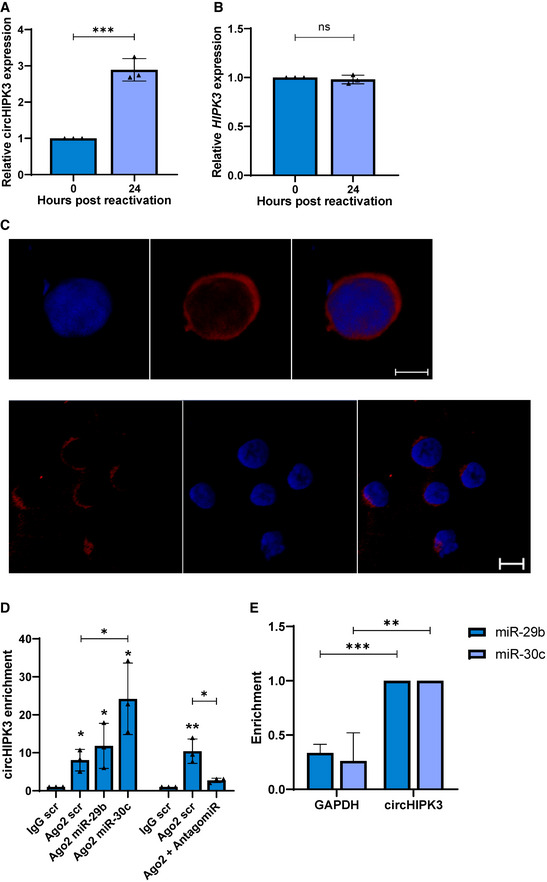
Figure 2. CircHIPK3 sponges miR‐29b and miR‐30c.

-
A, BqPCR analysis of TREx 0 and 24 post‐induction (n = 3) using GAPDH as a housekeeper, analysis is of levels of circHIPK3 (A) and HIPK3 (B).
-
CFISH analysis of TREx cells reactivated for 16 h with probes against circHIPK3 (red). DAPI was used as nuclei stain (blue), scale bars represent 5 μm on upper panel and 10 μm on lower panel. The lower panel shows a wider field of view.
-
DqPCR analysis of Ago2 RIPs in TREx cells transfected with scr, miR‐29b or miR‐30c showing circHIPK3 enrichment over GAPDH, with each repeat normalised to an IgG scr RIP (n = 3).
-
EqPCR analysis of Streptavidin RIPs of circHIPK3 or GAPDH enrichment in HEK‐293T cells transfected with either biotinylated miR‐29b or miR‐30c over scr (n = 4).
Data information: In (A, B, D and E) data are presented as mean ± SD. *P < 0.05, **P < 0.01 and ***P < 0.001 (unpaired Student’s t‐test). All repeats are biological.
Source data are available online for this figure.
