
Figure 6. CircHIPK3:miR‐30c:DLL4 dysregulation affects cell cycle.
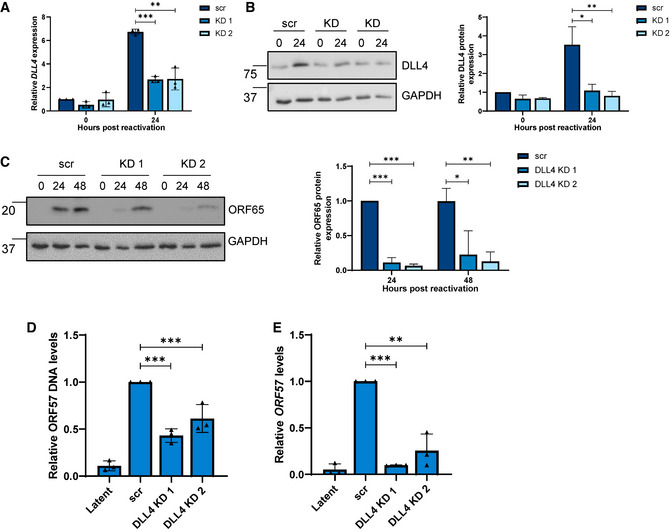
- qPCR of DLL4 expression in stable expression scr and two DLL4 KD TREx cell lines at 0 and 24 h post‐induction. GAPDH was used as a housekeeper (n = 3).
- Representative western blot of DLL4 levels in scr and DLL4 KD TREx cells with GAPDH as a loading control, densitometry analysis is n = 3.
- Representative western blot of ORF65 levels at 0, 24 and 48 h post‐induction in scr and DLL4 KD TREx cells, GAPDH was used as a loading control and densitometry analysis performed on n = 3.
- qPCR analysis of ORF57 DNA levels for viral load at 72 h post‐induction, with scr and DLL4 KD cells with uninduced cells as a control and GAPDH as a housekeeper (n = 3).
- qPCR analysis of ORF57 in HEK‐293T cells for reinfection assay (n = 3).
Data information: In (A–E), data are presented as mean ± SD. *P < 0.05, **P < 0.01 and ***P < 0.001 (unpaired Student’s t‐test). All repeats are biological.
Source data are available online for this figure.