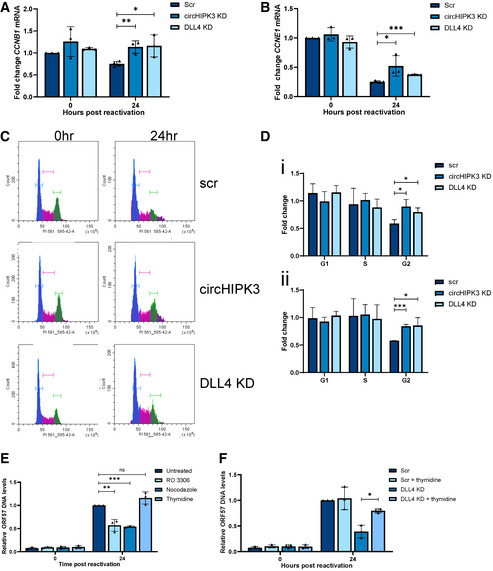
Figure 7. CircHIPK3:miR‐30c:DLL4 dysregulation affects cell cycle.

-
A, BqPCR of CCNB1 and CCNE1 levels in scr, circHIPK3 KD and DLL4 KD cells at 0 and 24 h post‐induction (n = 3).
-
C, DRepresentative plot of cell cycle distribution at 48 h post‐induction in scr, circHIPK3 and DLL4 KD cells, with G1 phase (blue), S phase (pink) and G2/M phase (green) highlighted. (D) Analysis of fold change in number of cells in G1, S and G2/M phases of the cell cycle from 0 to 24 h post‐induction (n = 4) (i) or 0 to 48 h post‐induction (n = 3) (ii). Cells used were scr, circHIPK3 KD or DLL4 KD stable TREx cells and cycle analysis was performed using propidium iodide and flow cytometry (n = 3).
-
EqPCR for ORF57 DNA levels in TREx cells at 48 h post‐lytic induction with treatment of RO 3306, nocodazole or thymidine (n = 3).
-
FqPCR for ORF57 DNA levels at 48 h post‐lytic induction with treatment of RO 3306, nocodazole or thymidine in scr or DLL4 KD cell lines (n = 3).
Data information: In (A, B and D–F) data are presented as mean ± SD. *P < 0.05, **P < 0.01 and ***P < 0.001 (unpaired Student’s t‐test). All repeats are biological.
Source data are available online for this figure.
