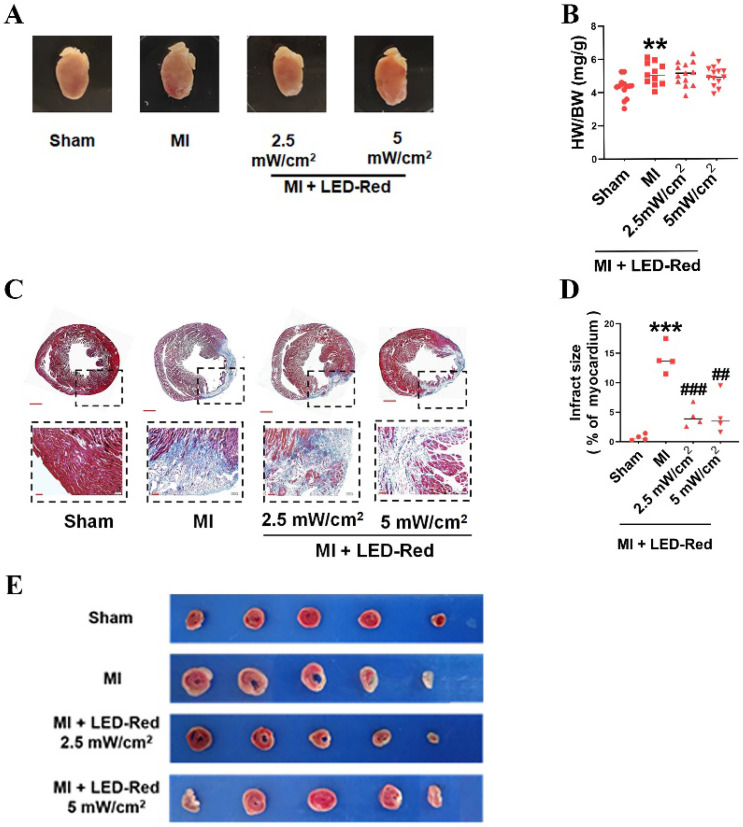
Figure 4.
LED-Red represses myocardial remodeling in adult mice after MI. (A) Heart morphology. (B) Heart to weight ratio (HW/BW) n = 13. (C), (E) Masson and TTC staining to detect the extent of MI. (D) Statistical graph of MI area. n = 4. Scale bar = 50 μm.The data represent the mean ± SEM. **P < 0.01, ***P < 0.001 vs. Sham, ##P < 0.01, ###P < 0.001 vs. MI.

