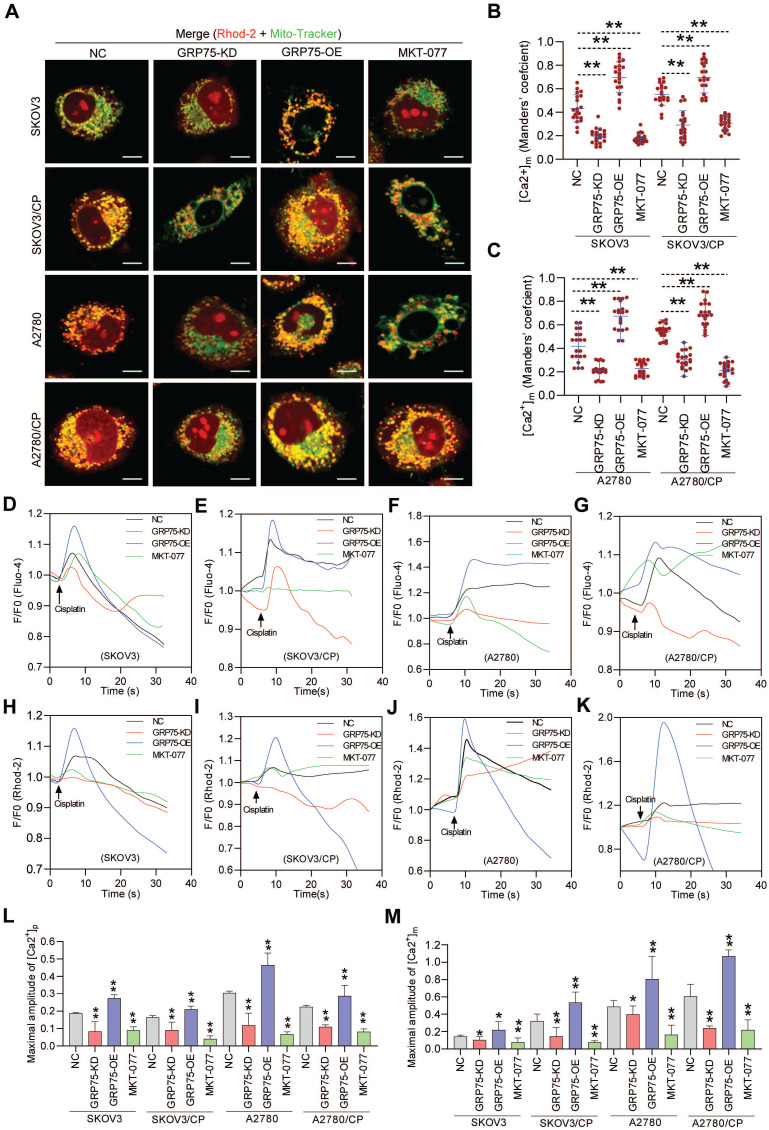
Figure 6.
GRP75-KD or inhibition decreased CP-induced mitochondrial Ca2+ uptake. (A) Representative confocal images of Rhod-2 (Red)- and Mito-Tracker (green)-loaded OC cells after GRP75 knock-down, overexpression, or inhibition with MKT-077; (B, C) Quantification of [Ca2+]m level (MCC of Rhod-2 signal overlapping with Mito-Tracker signal) in GRP75-expression-changed, CP-sensitive and -resistant OC cells. Mean ± SD; n=60 cells per group; (D-K) Representative time-course records of [Ca2+]i level (D-G) and [Ca2+]m level (H-K) in CP-treated OC cells after GRP75-KD, GRP75-OE, or inhibition with MKT-077; (L, M) Quantifications of the peak amplitude of CP-induced [Ca2+]i (L) and [Ca2+]m (M) levels in GRP75-expression-changed, CP-sensitive and -resistant OC cells. Data are Mean ± SD from 3 independent experiments, Student t test, **P < 0.01 compared to the NC group.

