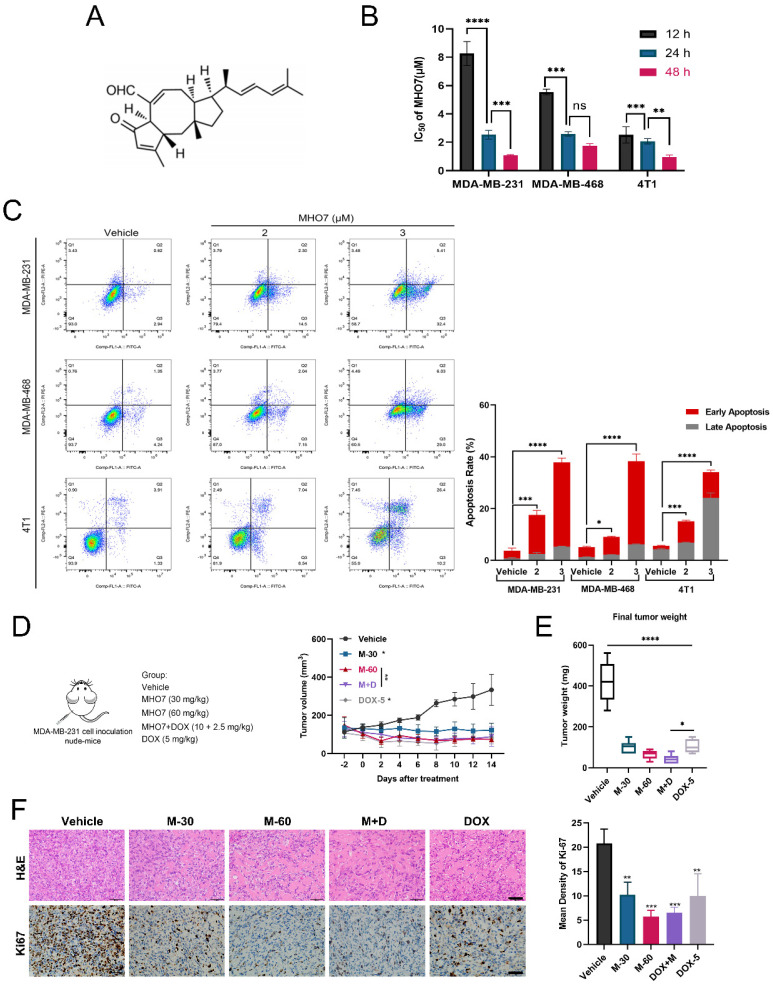
Figure 1.
Antitumor effect of MHO7 on TNBC in vitro and in vivo. (A) The chemical structure of MHO7. (B) The IC50 value of MHO7 on TNBC cell lines at 12, 24, and 48 h. (C) The percentages of apoptosis cells were measured by flow cytometry under MHO7 treatment at 24 h. (D) Tumor growth was measured in mice. Data was presented as mean ± SEM. (n=6). (E) Final tumor weight was measured in each group. Data was presented as mean ± SEM. (n=6). (F) Tumor tissue was analyzed by H&E staining and immunohistochemistry analysis of Ki67. Scale bars 50 µm. (n=3). *P <0.05; **P < 0.01; ***P <0.001; and**** P < 0.0001.

