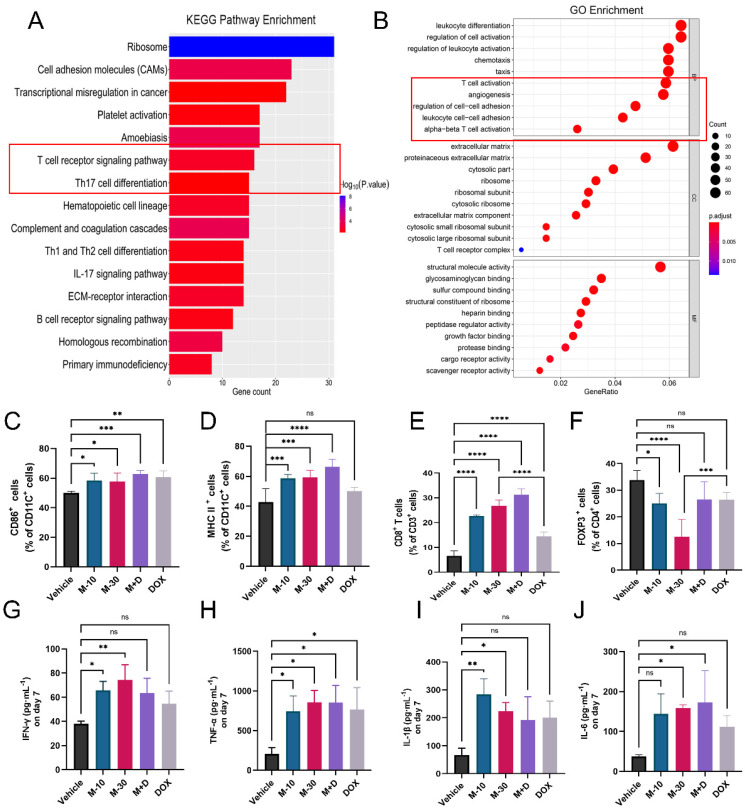
Figure 6.
MHO7 activated the antitumor immune response in mice. (A) KEGG pathway enrichment of DEGs was analyzed by RNA-seq in 4T1 tumor tissue. (B) GO enrichment of DEGs was analyzed by RNA-seq in 4T1 tumor tissue. (C) Percentages of CD11C+/CD86+ DCs were measured by flow cytometry in spleens. (D) Percentages of CD11C+/ MHC II+ DCs were measured by flow cytometry in spleens. (E) Percentages of CD3+/CD8+ T cells were measured by flow cytometry in spleens. (F) Percentages of CD4+/FOXP3+ T cells were measured by flow cytometry in spleens. (n=6) The level of (G) IFN-γ, (H) TNF-α, (I) IL-1β, and (J) IL-6 were measured by ELISA in the serum on day 7 after treatment. Data was presented as mean ± SEM. *P <0.05; **P < 0.01; ***P <0.001; and ****P < 0.0001; ns=no significance.

