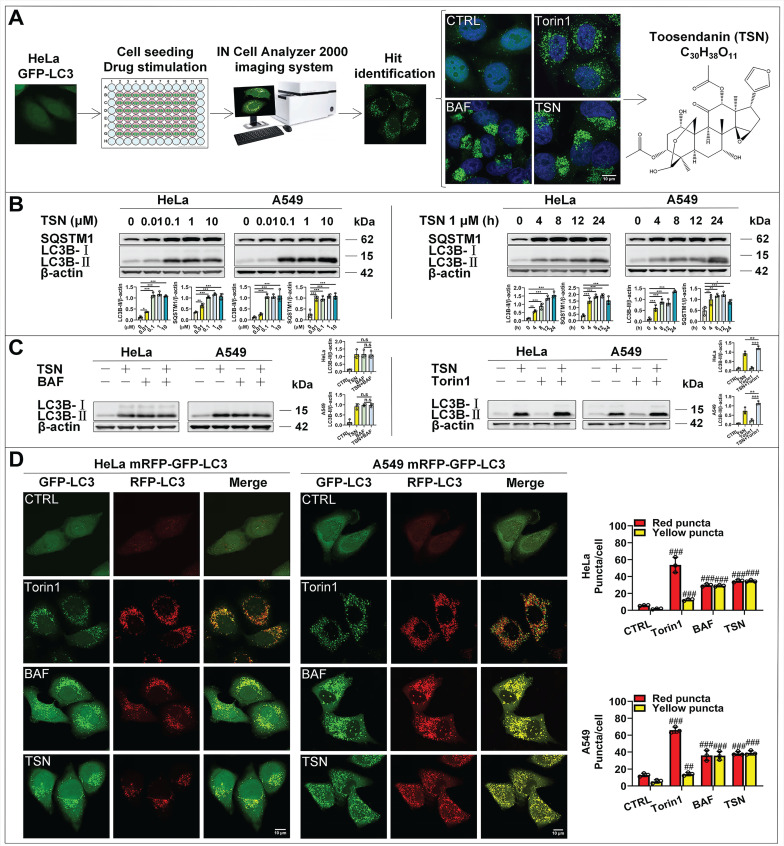
Figure 1.
The identification of the autophagy inhibitor TSN. (A) Results of high-content screening for chemical autophagy modulators. (B) WB analysis of LC3B-II and SQSTM1/p62 protein levels in HeLa and A549 cells treated with TSN (0.01~10 μM) or TSN 1 μM for (0~24 h) (n=3). (C) WB analysis of LC3B-II protein level in HeLa and A549 cells treated with TSN 1 μM in the absence or presence of BAF 100 nM or Torin1 200 nM for 24 h (n=3). (D) HeLa and A549 cells stably expressing mRFP-GFP-LC3 were treated with Torin 200 nM, BAF 100 nM, TSN 1 μM for 12 h, and LSCM was applied to capture the fluorescent images (scale bar = 10 μm). The average number of red and yellow dots per cell was quantified (n≥30, 3 biological repeats). ##P<0.01, ###P<0.001 (vs. Control), *P<0.05, **P<0.01. ***P<0.001. ns, not significant.

