Figure 3.
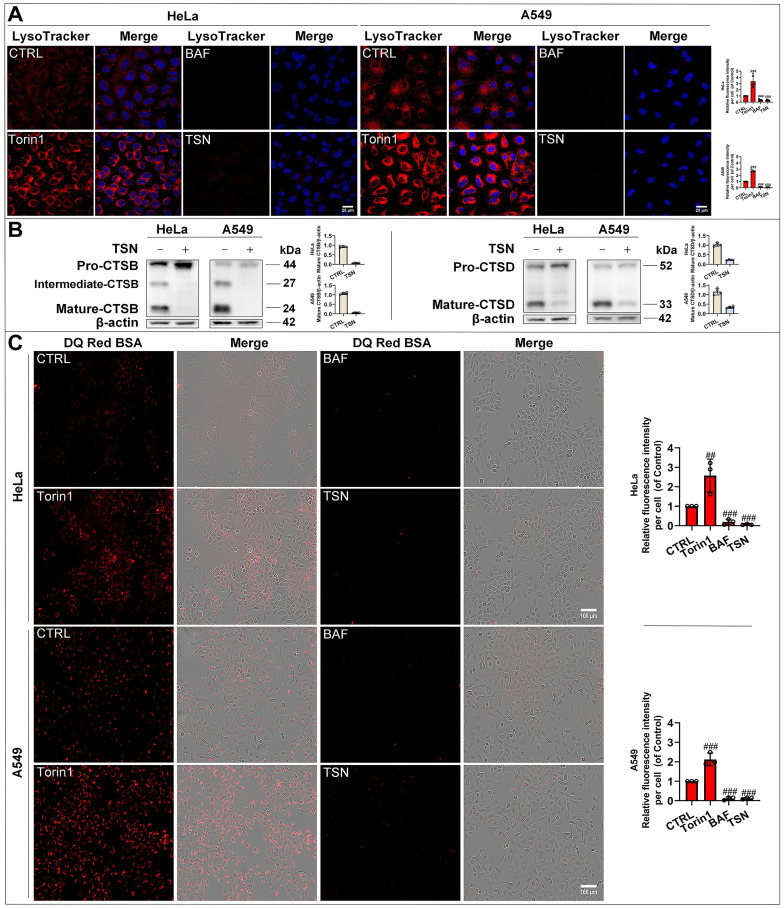
TSN impairs lysosomal proteases hydrolytic activity. (A) HeLa and A549 cells were treated with Torin1 200 nM, BAF 100 nM, TSN 1 μM for 24 h, followed by LysoTracker Red staining, and LSCM was applied to capture the fluorescent images (scale bar = 25 μm). The cell nuclei were stained with Hoechst. The relative red fluorescence intensity per cell in each treatment was measured and analyzed (n≥30, 3 biological repeats). (B) WB analysis of CTSB and CTSD protein levels in HeLa and A549 cells treated with 0.1% DMSO or TSN 1 μM for 24 h (n=4). (C) HeLa and A549 cells were pre-incubated with DQ Red BSA for 2 h, and then treated with Torin1, BAF, or TSN 400 nM for 6 h, and IncuCyte S3 live-cell analysis system was applied (scale bar = 100 μm). The relative red fluorescence intensity per cell in each treatment was measured and analyzed (n≥30, 3 biological repeats). ##P<0.01, ###P<0.001 (vs. Control).

