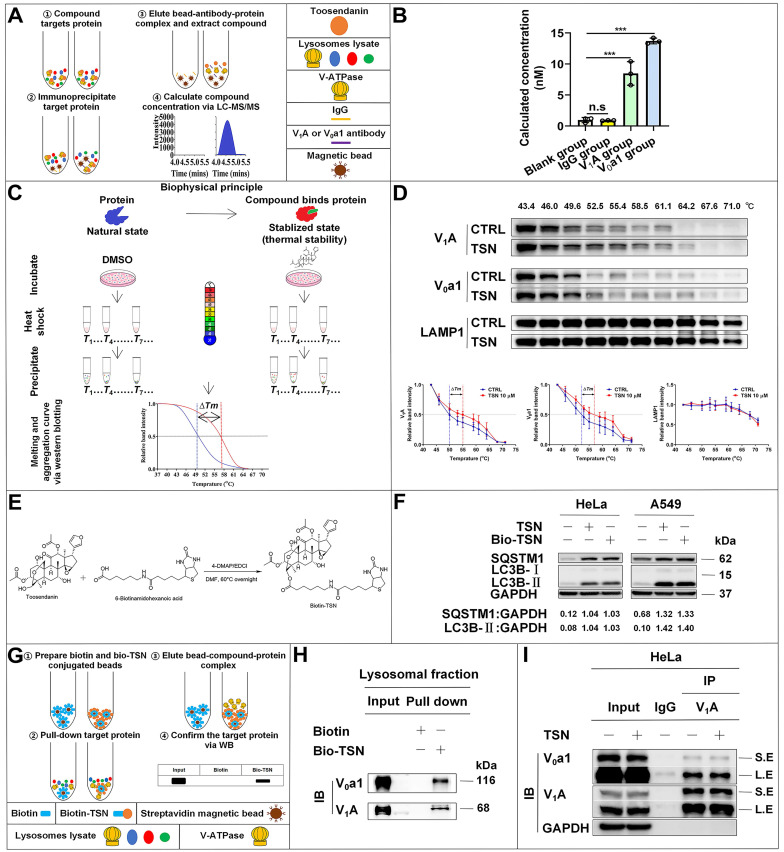
Figure 5.
TSN directly binds to V-ATPase. (A)-(B) Immunoprecipitation-coupled LC-MS/MS analysis. Lysosomes lysate was incubated with TSN for 2 h, and then subject to immunoprecipitation with IgG, V1A, and V0a1 antibodies. The proteins were precipitated by methanol and the concentration of TSN was analyzed by LC-MS/MS analysis (n=3). (C)-(D) Cellular thermal shift assay. HeLa cells were treated with 0.1% DMSO or TSN for 1 h, and followed by 3 min heating at indicated temperature (43 to 71 ℃). The cell lysates were analyzed by WB to determine the V1A and V0a1 protein levels. The band intensity in each temperature was normalized to the band intensity at the lowest temperature and the thermal aggregation curves is made following the quantification of the WB (n=3). (E) Biotin-TSN synthesis process. (F) WB analysis of LC3B-II and SQSTM1/p62 protein levels in HeLa and A549 cells treated with TSN or bio-TSN 1 μM for 24 h. The ratio of target protein/GAPDH was calculated based on the band intensity. (G)-(H) Bio-TSN pull-down assay. Biotin or Bio-TSN conjugated streptavidin magnetic beads were incubated with lysosomal fraction to pull down the Biotin and Bio-TSN binding proteins, and the presence of V-ATPase in the purification fraction was determined by WB detection of V0a1 and V1A. (I) Co-immunoprecipitation assay. HeLa cells were treated with 0.1% DMSO or TSN 100 nM for 12 h, followed by co-immunoprecipitation of IgG and V1A, detected the protein levels of V0a1, V1A, and GAPDH. S.E, short-time exposure; L.E, long-time exposure. ***P<0.001. ns, not significant.

