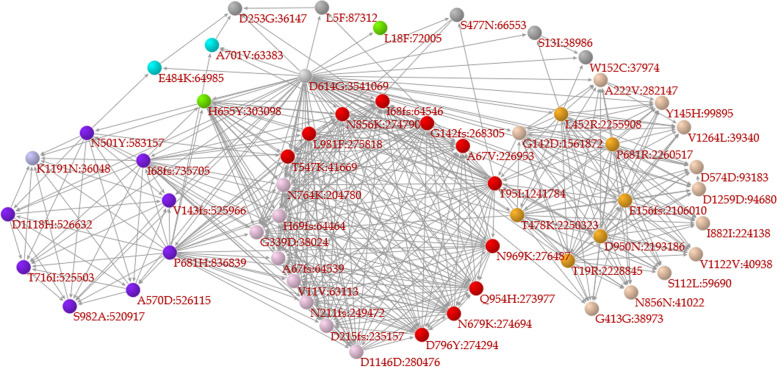
Fig. 4.
A correlation network composed of major mutations. When the frequency of a mutation is 1% or larger among the specimens studied, the mutation is classified as a major mutation in the present research. In the network, a node (Mutation A) represents a major mutation and is connected to another node (Mutation B) based on the recall index from Mutation A to Mutation B (). The coloration of the nodes depends upon the network modules, in which nodes are tightly connected to each other. Purple, orange, and red nodes represent mutations contained in Alpha, Delta, and Omicron variants, respectively. The direction of the arrow is based on the recall index from one node (Mutation B) to another node (Mutation A), in the opposite direction of the recall index

