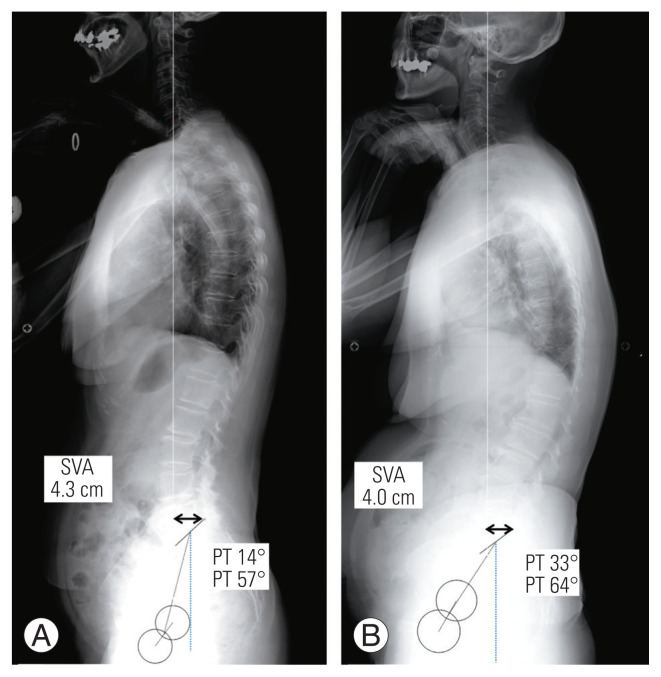
Fig. 1.
Radiographs of representative cases in the low and the high pelvic tilt (PT) groups. (A) Low PT group: sagittal vertical alignment (SVA) of 43 mm and PT of 14º are both within the normal ranges and the patient was classified into the low PT group. (B) High PT group: SVA of 40 mm is within the normal range but PT is 33º and the patient was classified into the high PT group.

