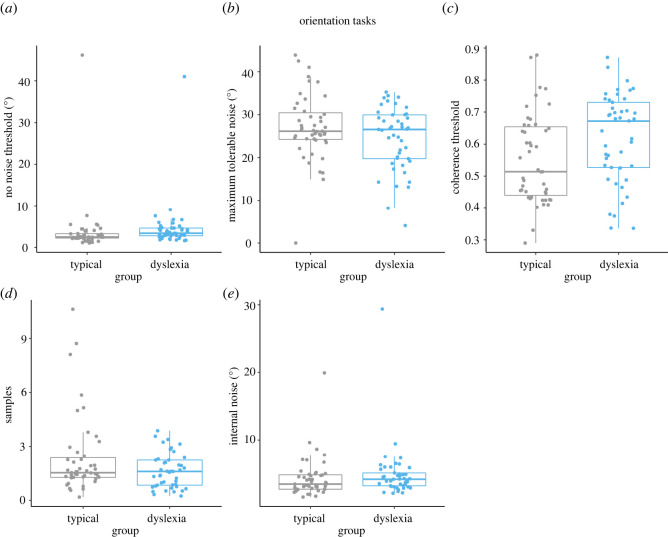
Figure 4.
Box plots showing individual threshold estimates (a–c) and equivalent noise modelling estimates (d,e) in the orientation tasks, for typically developing children (grey) and dyslexic children (blue). Group comparisons were conducted on coherence thresholds (c), sampling estimates (d) and internal noise estimates (e).

