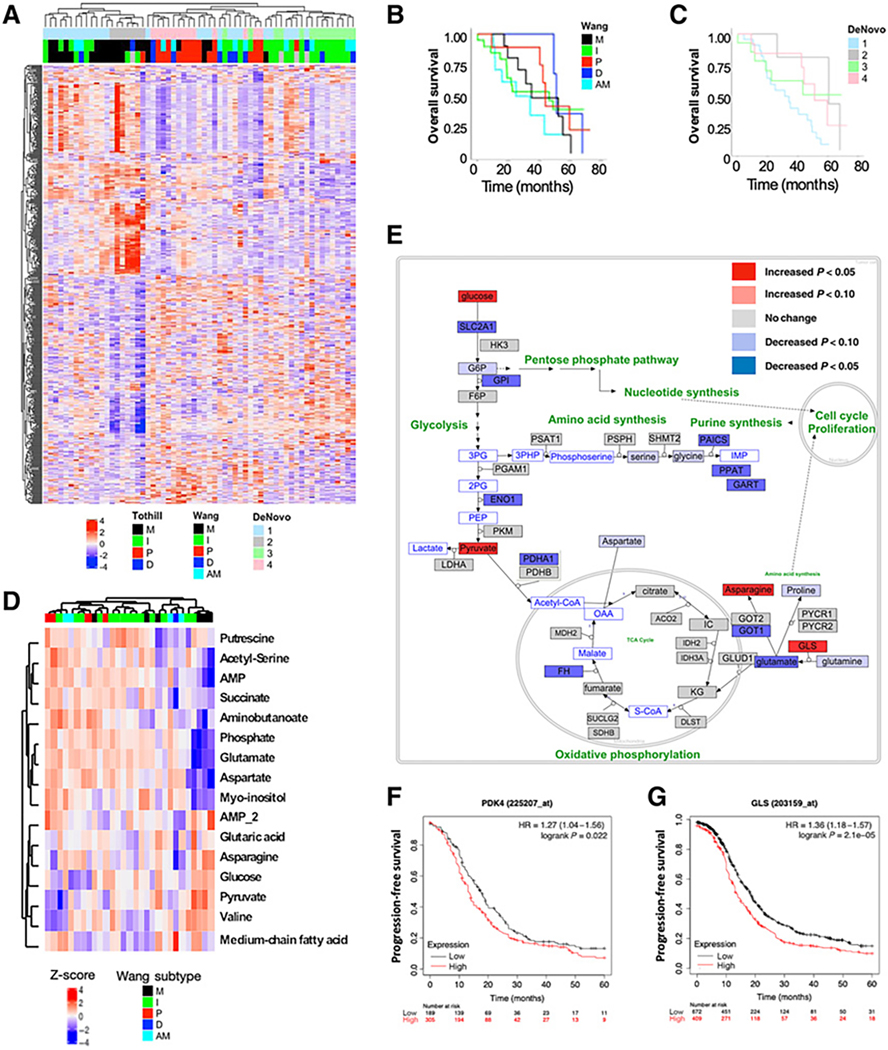
Figure 1.
HGSOC tissues vary from benign and harbor transcriptional and metabolic heterogeneity. Full RNA-seq and pathway analysis was performed on 61 stage IIIC/IV HGSOC patients and 11 benign tissues. A, Consensus clustering using the top 1,500 DEGs in HGSOC treatment-naïve tumor tissue defined 4 clusters (DeNovo 1–4), and we compared each cluster’s gene expression profile with previously defined transcriptional subtypes (Tothill et al. 2008; Wang et al. 2017). Kaplan–Meier (KM) curves for overall survival (OS) based on Wang-defined (B) and DeNovo-defined subtypes (C) show no statistical difference in OS among the subtype groups. Metabolomics data generated by GCxGC-MS is displayed for 30 treatment-naïve HGSOC tissues. D, Hierarchical clustering of the top 25 metabolites most different among the five transcriptional subtypes is shown. E, An analysis of gene expression and metabolite differences associated with the mesenchymal subtype show significant metabolic changes related to energy metabolism. Glucose, pyruvate, asparagine, and glutaminase (GLS) were among those significantly increased (P < 0.05) in the mesenchymal compared with the other subtypes (red). Kaplan–Meier (KM) curves for patient survival based on gene expression of PDK4 (F; HR = 1.27, P = 0.022) and GLS (G; HR = 1.36, P < 0.001) in ovarian cancer.

