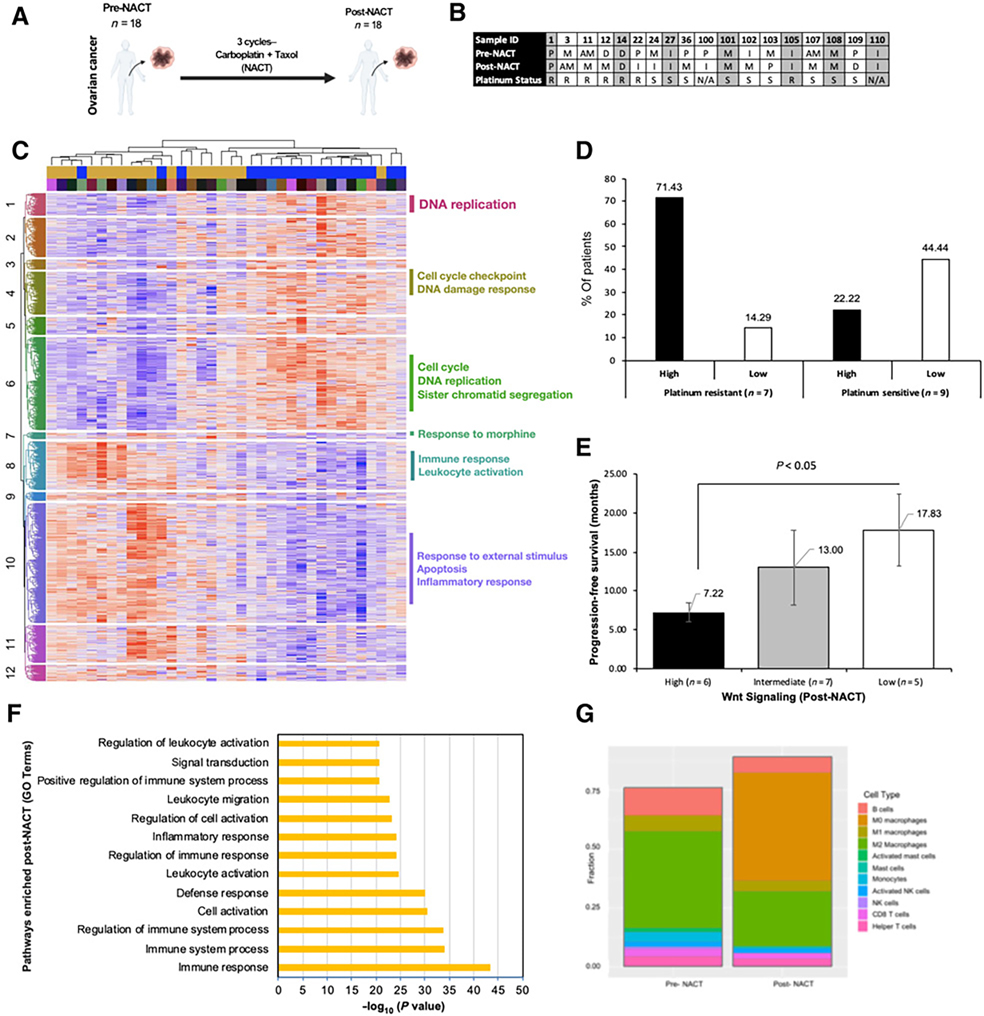
Figure 4.
Transcriptomic analysis of tumors in response to NACT. A, We collected samples from 18 patients with matching chemo-naïve tissue (pre-NACT) and tissue collected after 3 to 6 cycles of NACT (post-NACT). B, Table of individual patient’s (Sample IDs in the first row) pre- and post-NACT tumor transcriptional subtype assignment (Wang et al. 2017). Only 39% (n = 7) of patients maintained their transcriptional subtype in response to NACT. Out of the patients whose transcriptional subtype was unchanged 50% were platinum sensitive (PS = S) and 50% were platinum resistant (PR = R). Of the patients whose transcriptional subtype did change, 60% were PS and 40% were PR. C, Hierarchical clustering using all genes with FDR < 0.05 separates pre- and post-NACT samples. D, Percentage (%) of patients with high versus low WNT signaling in platinum-resistant versus -sensitive patient groups. E, PFS is significantly better in patients whose WNT signaling activity is lower in post-NACT tissue. F, Pathway analysis of DEGs identified pathways enriched in post- versus pre-NACT tissues. G, Abundance of specific immune cell types compared in pre- and post-NACT tissues.

