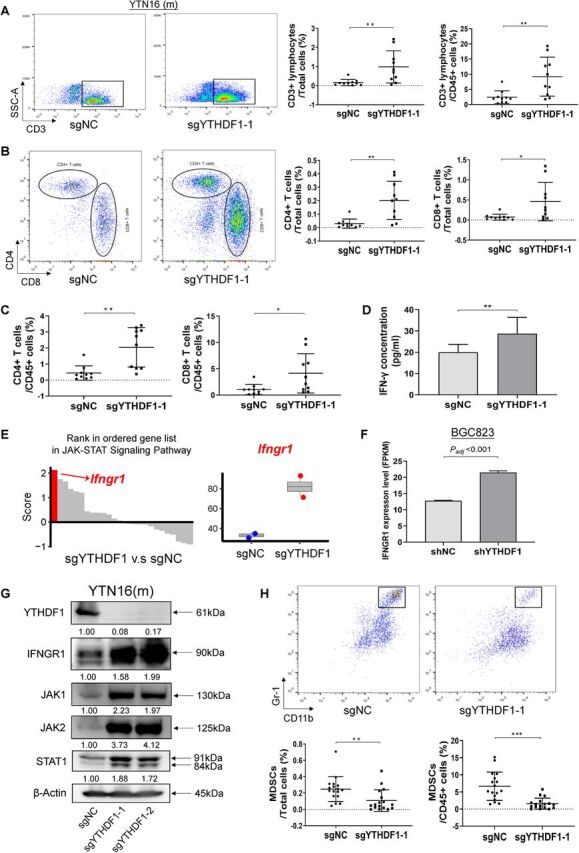
Figure 5.

Loss of YTHDF1 in tumor cells activates the adaptive antitumor immunity. (A) Representative images of CD3+ lymphocytes infiltration in the YTN16 tumor by flow cytometry, expressed as the percentage of whole tumor or infiltrating immune cell (CD45+) population. (B) Representative images of infiltrating CD4+ T cells and CD8+ T cells by flow cytometry, expressed as the percentage of whole tumor. (C) CD4+ T cells and CD8+ T cells expressed as the percentage of infiltrating immune cell (CD45+) population. (D) Levels of IFNγ in tumors from control and YTHDF1 knockout YTN16 groups. (E) Rank in ordered gene list in JAK-STAT signaling pathway enriched in YTN16 cells with YTHDF1 knockout. The top induced gene in this pathway was Ifngr1. (F) IFNGR1 mRNA expression of BGC823 cell in RNA-sequencing data between two groups. (G) Western blot of IFNGR1 and JAK/STAT1 signaling molecules in GC cells. (H) Representative images of infiltrating MDSCs by flow cytometry, expressed as the percentage of whole tumor or infiltrating immune cell (CD45+) population. *P<0.05; **p<0.01, ***p<0.001. IFN, interferon.
