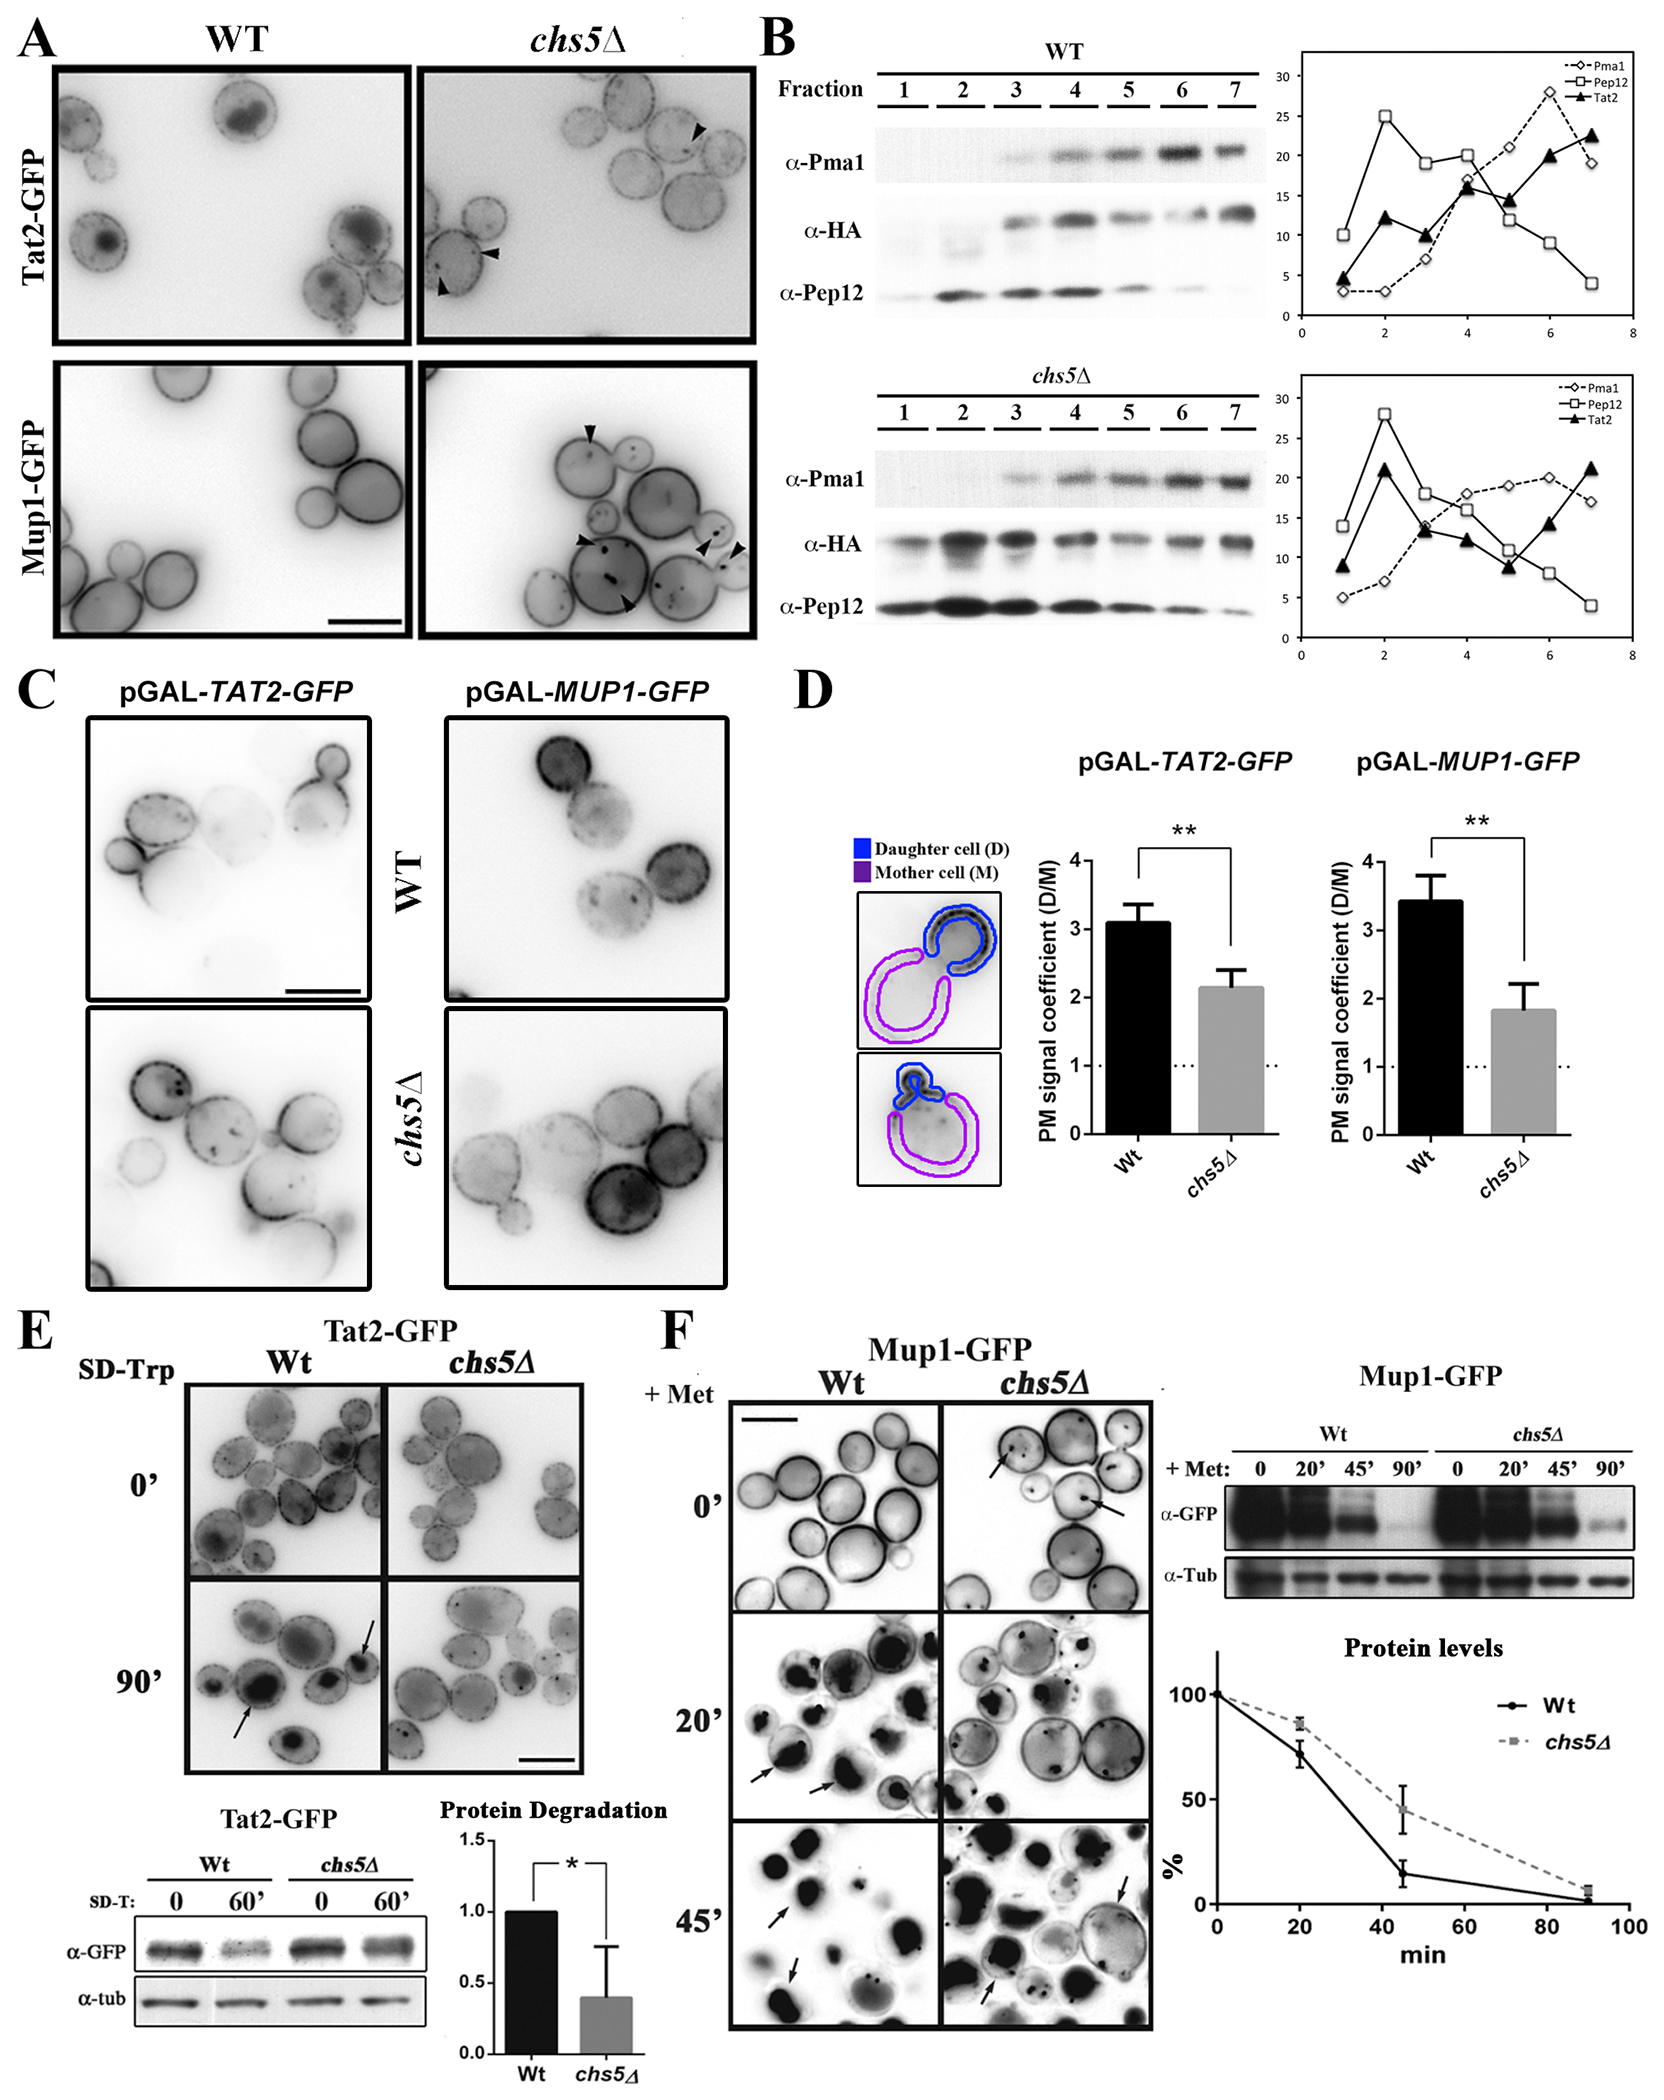
Figure 2.

Exomer controls the traffic of several amino acid permeases. (A) Localization of Tat2-GFP and Mup1-GFP under steady state growth conditions in induction media. Note the subtle differences of Tat2 and Mup1 intracellular localization in the exomer mutant and their accumulation at intracellular spots (see arrowheads). (B) Intracellular distribution of Tat252-53-3xHA in wild-type and chs5∆ strains after discontinuous subcellular fractionation. Proteins were visualized by Western blot as described in the Material and Methods section. Graphs on the right represent the percentage of each protein at each fraction. Pma1 and Pep12 were used as markers for the PM and TGN/endosome fraction respectively. (C) Analysis of the PM anterograde transport of Tat2-GFP and Mup1-GFP, with their gene expression under the control of the GAL1 promoter. In both cases, for pGAL-TAT2-GFP and pGAL-MUP1-GFP strains, the cells were grown O/N in SD 2 % raffinose media and then transferred to a SD 2% galactose media. In the case of Tat2, and taking in to account the lethality of the lack of Tat2, 0.02% Trp was added to the SD raffinose media and the galactose induction phase was done in a SD media with standard tryptophan concentrations (0.002 %). All images were acquired just one hour after the addition of galactose. (D) Quantitative analysis of the polarization of these proteins along the PM using images from the experiment shown in C. A daughter cell/ mother cell PM signal coefficient was measured following the scheme shown in the left panel (details in Material and Methods section). The horizontal dashed line represents the condition of the lack of polarization of PM protein distribution. (E) Localization and dynamics of Tat2-GFP after the induction of its endocytosis in Trp-depleted media (53). The same experiment was analyzed by Western blot and relative protein degradation after 60 min of induction was calculated from 3 independent experiments (lower panels). (F) Localization and dynamics of Mup1-GFP after the induction of its endocytosis by adding methionine (20 mg/L) (54). The same experiment was analyzed by Western blot and relative protein levels were calculated for each point (lower panel).
