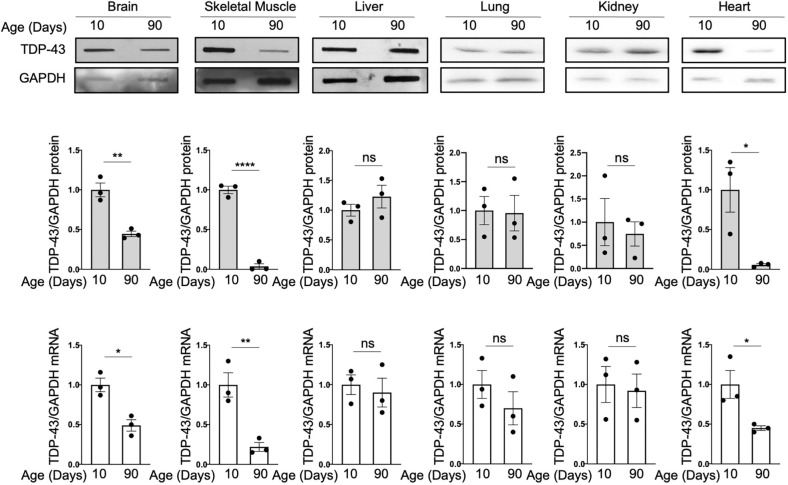
Fig. 1.
TDP-43 relative expression levels at 10 and 90 days in different mice tissues. (A) Upper panel: representative western blots showing TDP-43 levels in 10- and 90-day mice tissues (n=3, two males and one female for each group). GAPDH was used as loading control. Middle panel: quantification of the western blots, showing the relative expression level of TDP-43 in the tissue between the two timepoints. Lower panel: quantification of relative TDP-43 mRNA levels between the two timepoints. Values are normalized for GAPDH and expressed as fold over TDP-43 level in 10-day-old tissues. Data are mean±s.e.m. (n=3 with two technical replicates for each animal sample). Black circles represent individual data points. Pairwise comparison was performed using an unpaired two-tailed Student's t-test. *P<0.05, **P<0.01; ****P<0.0001; ns, not significant.

