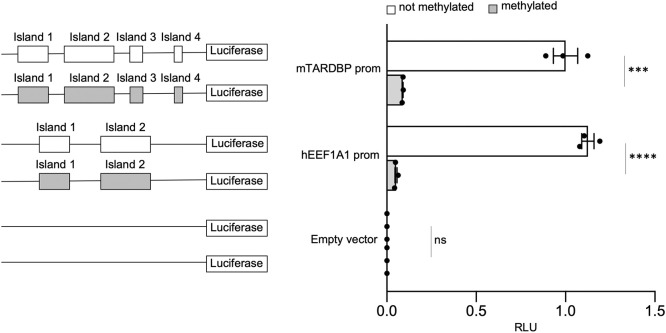
Fig. 3.
In vitro methylation of the mouse Tardbp promoter. EEF1A1 and the empty pCpGfree-basic-Lucia vector were used as positive and negative controls, respectively. On the left of each quantification, cartoons of the constructs used in the assay are shown. White rectangles represent unmethylated CpG islands, and grey rectangles represent methylated CpG islands. Data are mean±s.e.m. (n=3). Solid black circles represent individual data points. Pairwise comparison was performed using an unpaired two-tailed Student's t-test. ***P<0.001; ****P<0.0001; ns, not significant.

