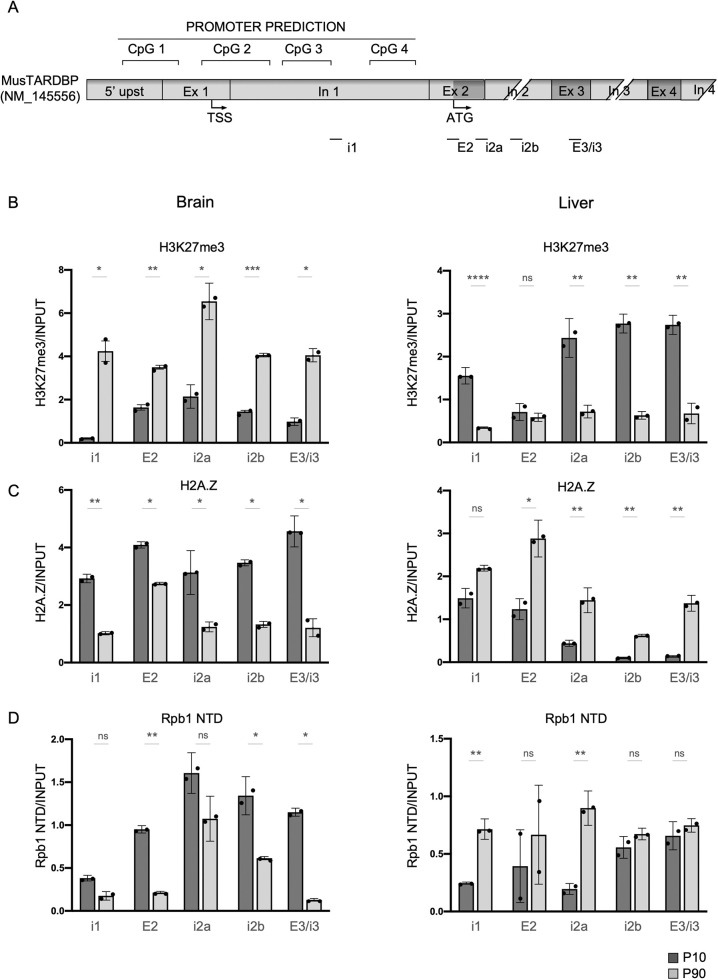
Fig. 4.
Analysis of the histone tail modifications, H3K27me3 and acetylated H2A.Z. (A) Cartoon of the mouse Tardbp promoter and the first four intronic/exonic sequences. Regions used for ChIP-qPCR analysis are indicated below. (B-D) Distribution in the promoter and along the gene of K27me3 (B), H2A.Z (C) and RNAPII (Rpb1 NTD) (D) in brain or liver tissue of 10-day-old mice (dark grey columns) compared to 90-day-old mice (light grey columns). Data are mean±s.e.m. (n=2 with two technical replicates for each biological replicate). Black circles represent individual data points. Pairwise comparison was performed using an unpaired two-tailed Student's t-test. *P<0.05; **P<0.01; ***P<0.001; ****P<0.0001; ns, not significant.

