Fig. 2.
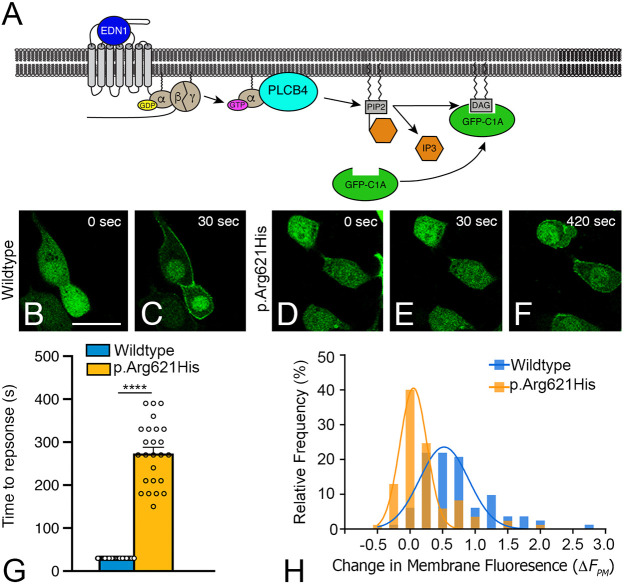
PLCB4 p.Arg621His attenuates EDNRA signaling. (A) Schematic showing endothelin 1 (EDN1)/endothelin A receptor (EDNRA) signaling triggering PLCB4-mediated PIP2 hydrolysis. This results in cytoplasm-to-plasma membrane translocation of the DAG sensor GFP-C1A. (B-F) Representative time-lapse images of the GFP translocation assay in HEK293T cells transfected with GFP-C1A, EDNRA and wild-type PLCB4 or PLCB4 p.Arg621His. Time relative to EDN1 addition is noted. Scale bar: 20 µm. (G) Quantification of the translocation response time observed in individual cells (open circles), with only responding cells used for data analysis (n=90 for wild-type PLCB4-tranfected cells and n=25 for PLCB4 p.Arg621His-transfected cells). Error bars represent s.e.m. Statistical significance was calculated using Prism and an unpaired two-tailed t-test (P<0001). ****P<0.0001. (H) Quantification of the translocation response profiles for cell populations expressing wild-type PLCB4 or PLCB4 p.Arg621His. The translocation response was quantified for individual cells by measuring the relative increase in membrane fluorescence, expressed as ΔFpm on the x-axis. The y-axis represents the percentage of total cells that elicited the indicated ΔFpm value. α, G protein α subunit q (Gαq); β, G protein β subunit; DAG, diacylglycerol; γ, G protein γ subunit; IP3, inositol triphosphate.

