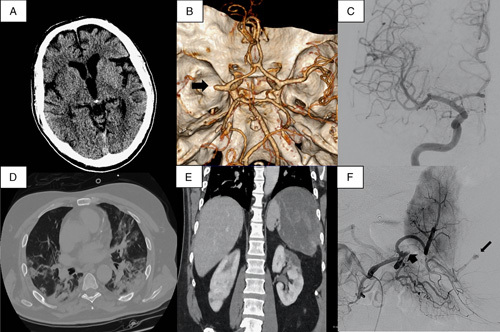
FIGURE 1.

(A) Noncontrast brain computed tomography (CT) on admission. (B) CT-angiogram, black arrow shows right M1 occlusion. (C) Cerebral angiography after mechanical thrombectomy (thrombolysis in cerebral infarction 3 recanalization). (D) Chest CT showing bilateral pneumonia. (E) Abdominal CT with splenic hematoma and bilateral renal infarction. (F) Splenic angiography, short arrow points to splenic occlusion and large arrow points to distal pseudoaneurysm.
